



The most effective ROI tracking setup combines a governed, reconciled data source with server-side event capture. For most marketing teams, that means choosing from a focused shortlist: MartechAI (unified platform with governed definitions and CRM sync), Cometly (server-side attribution for heavy ad spenders), Northbeam (ML-based media mix modeling), Dreamdata (account-level B2B attribution), and Ruler Analytics (lead-to-revenue for sales-driven teams). Each solves a distinct problem. The wrong choice wastes months of implementation time and produces numbers no one trusts.
The core issue most teams miss: platform-reported ROAS is routinely inflated because ad platforms claim full credit for the same conversion across channels. A reconciled ROI number, where every dollar traces back to CRM-recognized revenue, is a fundamentally different metric.
Immediate next steps:
- Audit your current data sources: ad platforms, CRM, and billing system
- Identify whether your sales cycle is transactional (DTC) or long-cycle (B2B)
- Confirm whether your team has server-side tracking in place
- Request a demo from two to three shortlisted tools and ask specifically about data lineage
- Run a 30-day pilot against a single channel before full deployment
Table of Contents
- How do the top ROI tracking tools for marketers compare?
- Tool profiles: what each platform actually does
- How do you choose the right ROI tracking tool for your team?
- What does a defensible attribution pilot actually look like?
- What does ROI tracking software actually cost?
- Which tool should you actually choose?
- Key Takeaways
- The gap between attribution tools and attribution discipline
- MartechAI gives you governed analytics without the reconciliation overhead
- Useful sources and further reading
- FAQ
How do the top ROI tracking tools for marketers compare?
| Tool | Best For | Attribution Model(s) | Key Features | Integrations | Data Accuracy | Setup Time | Pricing Shape | Scale |
|---|---|---|---|---|---|---|---|---|
| MartechAI | Unified platform: planning, CRM, and reconciled analytics | Multi-touch, CRM-synced | Campaign studio, CRM sync, deep analytics, AI insights, SEO, email | Ad platforms, CRM, e-commerce, content tools | Governed definitions; full metric traceability | Days to 2 weeks | Tiered SaaS subscription | SMB to mid-market |
| Cometly | Multi-platform ad spend with advanced attribution | First-party, server-side, multi-touch | Server-side capture, AI budget recommendations, ROAS reconciliation | Meta, Google, TikTok, Shopify, CRM | High; S2S reduces pixel loss | Hours to days | Tiered by ad spend | SMB to mid-market |
| Triple Whale | DTC Shopify brands needing fast creative analytics | Last-click, multi-touch, blended | Creative analytics, real-time ROAS, cohort reporting | Shopify-native, Meta, Google, Klaviyo | Good for Shopify; limited off-platform | Under 1 hour | Tiered by GMV | SMB to mid-market |
| Northbeam | High-spend brands needing media mix modeling | ML-based MMM, incrementality | Cross-channel MMM, incrementality testing, budget allocation | Major ad platforms, CRM, warehouse | High for MMM; requires data volume | Weeks | Custom/enterprise | Mid-market to enterprise |
| Rockerbox | Mixed offline and online media attribution | Multi-touch, offline + digital | Offline attribution, unified view, data export | TV, direct mail, digital, CRM | Good; offline methods add complexity | 1–2 weeks | Custom | Mid-market |
| Hyros | Complex funnels, high-value conversions | AI-based, multi-touch, long-window | Identity persistence, long attribution windows, ad optimization | Meta, Google, Stripe, major CRMs | High for complex funnels | Days to weeks | % of ad spend / custom | SMB to mid-market |
| Wicked Reports | Subscription/LTV-focused attribution | LTV-aware, multi-touch | LTV attribution, retention ROI, cohort analysis | Email platforms, CRM, Stripe | Good for subscription models | Days | Tiered by contacts | SMB |
| Ruler Analytics | B2B lead-gen with sales team handoff | Multi-touch, closed-loop | Lead-to-revenue tracking, CRM sync, call tracking | HubSpot, Salesforce, GA4, ad platforms | Good; CRM mapping takes setup | 1–2 weeks | Tiered by sessions | SMB to mid-market |
| Google Analytics 4 | Free event-level analytics with warehouse export | Last-click, data-driven (limited) | Event tracking, BigQuery export, funnel analysis | Native Google stack, broad connectors | Moderate; no CRM revenue sync | Hours | Free (BigQuery costs extra) | All sizes |
| HubSpot Marketing Analytics | HubSpot CRM users wanting pipeline attribution | CRM-native, multi-touch | Pipeline reporting, contact attribution, revenue dashboards | HubSpot CRM-native, ad platforms | High within HubSpot ecosystem | Hours to days | Bundled with HubSpot plans | SMB to enterprise |
| Dreamdata | B2B account-based attribution | Account-level, multi-touch | Buying-committee analysis, influence reports, pipeline attribution | Salesforce, HubSpot, ad platforms, warehouse | High for ABM | 1–3 weeks | Tiered / custom | Mid-market to enterprise |
| Supermetrics | Centralizing data into Sheets, Looker, or warehouse | Connector/pipeline (no attribution) | Wide connector coverage, automated data pulls | 100+ ad/analytics sources, warehouse | Good for data teams | Hours to days | Per connector / tiered | SMB to enterprise |
| Funnel.io | Data normalization and warehouse pipelines | Pipeline/ETL (no attribution) | Data normalization, automated pipelines, BI-ready output | 500+ sources, major warehouses | High for data teams | Days | Tiered by data volume | Mid-market to enterprise |
| Whatagraph | Agency multi-client reporting automation | Reporting layer (no attribution) | Visual report templates, white-labeling, cross-channel data | 40+ sources, ad platforms, GA4 | Reporting accuracy depends on sources | Hours | Per source / tiered | SMB agencies |
| Databox | Live dashboards and KPI alerting | Dashboarding (no attribution) | KPI monitoring, alerts, 70+ integrations | 70+ data sources | Good for dashboarding; no reconciliation | Under 1 hour | Freemium / tiered | SMB to mid-market |
| Kissmetrics | Behavioral cohorts and user lifecycle | Behavioral, cohort-based | User-level journeys, funnel analysis, cohort revenue | SaaS/e-commerce platforms, CRM | Moderate | Days | Tiered by events | SMB to mid-market |
| Hotjar | Conversion friction diagnosis | Behavioral (no revenue attribution) | Session replays, heatmaps, funnel drop-off | GA4, HubSpot, Segment | Qualitative; no revenue data | Under 1 hour | Freemium / tiered | SMB to mid-market |
| Cyfe | SMB consolidated dashboards | Dashboarding (no attribution) | Multi-source aggregation, pre-built widgets | 100+ services | Basic aggregation | Hours | Flat monthly | SMB |
| Planful | Finance-marketing spend reconciliation | Financial planning (no attribution) | Budget reconciliation, financial reporting, planning workflows | ERP, finance systems, CRM | Moderate to complex | Weeks | Enterprise license | Mid-market to enterprise |
| Clicks Geek ROI Dashboard | Pre-built ROI visibility for ad campaigns | Reporting layer | Pre-built templates, campaign-level ROI | Ad platforms | Basic; no CRM reconciliation | Hours | Not publicly listed | SMB |
| Lunio | Simplified dashboards for non-technical teams | Reporting layer | Simplified reporting, dashboard automation | Ad platforms, GA4 | Basic | Hours | Not publicly listed | SMB |
Pricing band summary:
- Mid-market ($200–$1,500/month): — MartechAI, Cometly, Triple Whale, Ruler Analytics, Wicked Reports, Whatagraph, Supermetrics, Kissmetrics, Lunio
- Enterprise/custom: Northbeam, Rockerbox, Hyros, Dreamdata, Funnel.io, Planful, Northbeam
Tool profiles: what each platform actually does
MartechAI
MartechAI, built on the Derail Logic platform, is the option for teams that want planning, execution, and measurement in one governed environment. Rather than stitching together a separate attribution tool, a CRM, and a reporting layer, MartechAI connects campaign studio, CRM, deep analytics, SEO auditing, and email into a single workflow. Metric definitions are set once and applied consistently across every report, which eliminates the reconciliation work that plagues multi-tool stacks.
- Revenue attribution with CRM sync and campaign-level traceability
- AI-driven insights generated from your actual business data, not generic benchmarks
- Visual campaign studio with built-in performance dashboards
- Email marketing, landing page builder, and social scheduling in one platform
- Setup typically takes days to two weeks depending on CRM complexity
Best for teams that want a single, auditable source of truth rather than a patchwork of point solutions.
Cometly
Cometly focuses on server-side tracking and conversion sync, which matters most when iOS privacy changes and cookie deprecation degrade pixel-based signals. Its AI layer recommends budget shifts based on reconciled attribution data rather than platform-reported ROAS. Setup is fast for e-commerce and direct-response advertisers.
- Server-side capture and Conversion API patterns for Meta, Google, TikTok
- AI-driven budget allocation recommendations
- Multi-touch attribution with platform ROAS reconciliation
- Integrates with Shopify, major CRMs, and ad platforms
- Typical setup: hours to a few days for standard integrations
Triple Whale
Triple Whale is purpose-built for Shopify DTC brands. Its strength is speed: a merchant can connect their store and see creative-level ROAS data within an hour. The trade-off is that its attribution is largely Shopify-centric, so brands running significant offline or non-Shopify channels will hit limits quickly.
- Real-time creative performance analytics
- Blended ROAS and cohort reporting
- Native Shopify integration with Meta, Google, and Klaviyo connectors
- Setup: under one hour for Shopify merchants
Northbeam
Northbeam applies machine-learning media mix modeling to cross-channel spend data, making it one of the few tools that can run incrementality testing alongside attribution. It requires meaningful data volume to produce reliable models, so it fits brands spending at scale across many channels.
- ML-based MMM and incrementality testing
- Cross-channel budget allocation modeling
- Integrates with major ad platforms, CRM, and data warehouses
- Implementation: weeks, with ongoing model calibration
Rockerbox
Rockerbox stands out for its ability to incorporate offline channels, including TV and direct mail, alongside digital conversions. For brands running mixed-media campaigns, that unified view is difficult to replicate with digital-only tools.
- Offline attribution methods combined with digital tracking
- Unified attribution view across all channels
- Data export to warehouses for custom modeling
- Setup: one to two weeks
Hyros
Hyros is built for businesses with complex, high-value funnels where a single customer may touch multiple devices and take weeks to convert. Its identity-persistence layer tracks users across touchpoints over long windows. Hyros markets an ad revenue lift from improved tracking signals, though teams should validate the actual uplift in their own pilot before budgeting around it.
- Long-window, cross-device identity tracking
- AI-based attribution with ad platform signal feedback
- Integrates with Meta, Google, Stripe, and major CRMs
- Setup: days to weeks depending on funnel complexity
Wicked Reports
Wicked Reports is the clearest choice for subscription businesses that need to understand which acquisition channels produce the highest lifetime value, not just the first conversion. Its LTV-aware attribution feeds retention-focused ROI reporting.
- LTV attribution across customer lifecycles
- Cohort analysis tied to subscription revenue
- Integrates with email platforms, CRM, and Stripe
- Setup: days
Ruler Analytics
Ruler Analytics closes the loop between marketing touchpoints and closed deals in the CRM, making it the practical choice for B2B lead-gen teams with sales handoffs. It tracks calls, forms, and chat alongside digital touchpoints, then pushes revenue data back to the marketing source.
- Closed-deal attribution linking touchpoints to CRM outcomes
- Call tracking and form attribution
- Integrates with HubSpot, Salesforce, GA4, and ad platforms
- Setup: one to two weeks, with CRM field mapping as the main variable
Google Analytics 4
GA4 is the baseline for most teams: free, broad, and deeply integrated with the Google stack. Its native BigQuery export makes it a useful raw data layer for teams building custom attribution models. The limitation is that GA4 does not natively reconcile to CRM-recognized revenue, so it works best as a component of a larger data stack rather than a standalone ROI tool.
- Event-based measurement with funnel analysis
- BigQuery export for custom modeling
- Free core product; warehouse costs apply separately
- Setup: hours
HubSpot Marketing Analytics
For teams already running HubSpot CRM, the built-in marketing analytics layer offers pipeline attribution and revenue reporting without additional integration work. The depth of attribution is tied to HubSpot’s contact and deal model, so teams with complex multi-system revenue data may need supplementary tools.
- CRM-native attribution and pipeline reporting
- Contact-level journey tracking
- Bundled with HubSpot plans; no separate pricing
- Setup: hours to days within the HubSpot ecosystem
Dreamdata
Dreamdata is the strongest option for B2B teams running account-based motions. It maps influence across buying committees, not just individual contacts, and produces account-level attribution reports that connect marketing activity to pipeline and closed revenue.
- Account-level attribution and buying-committee analysis
- Multi-touch influence reporting
- Integrates with Salesforce, HubSpot, ad platforms, and warehouses
- Setup: one to three weeks
Supermetrics
Supermetrics is a data pipeline tool, not an attribution platform. It pulls data from 100+ ad and analytics sources into Google Sheets, Looker Studio, or a warehouse, where teams can build their own models. It is the right choice when you have a data analyst who wants raw, normalized data rather than a pre-built attribution layer.
- Wide connector coverage across ad platforms and analytics tools
- Automated data pulls into reporting destinations
- No built-in attribution; modeling happens downstream
- Setup: hours to days
Funnel.io
Funnel.io operates similarly to Supermetrics but with a stronger focus on data normalization and warehouse pipelines. It connects 500+ sources and outputs clean, BI-ready data. Teams with a mature data infrastructure and a need for custom attribution modeling will find it more flexible than pre-built tools.
- Data normalization and automated pipelines to warehouses
- 500+ source connectors
- No attribution layer; designed for BI and custom modeling
- Setup: days
Whatagraph
Whatagraph automates the reporting workflow for agencies managing multiple clients. It pulls cross-channel data into visual, white-labeled report templates. Attribution accuracy depends entirely on the quality of the source data it pulls from, so it is a reporting layer, not an attribution engine.
- Visual report templates and white-labeling
- Cross-channel data aggregation for client reports
- Integrates with 40+ sources including ad platforms and GA4
- Setup: hours
Databox
Databox connects to 70+ data sources and surfaces live KPI dashboards with alerting. Its freemium tier makes it accessible for small teams that need consolidated visibility without engineering effort. Like Whatagraph, it is a dashboarding layer rather than an attribution tool.
- Live KPI monitoring and alerts
- 70+ integrations with rapid setup
- Freemium entry point
- Setup: under one hour
Kissmetrics
Kissmetrics tracks user-level behavioral events and ties them to revenue through cohort and funnel analysis. It suits product-led growth teams that want to understand which behaviors predict conversion and retention, rather than which ad channels drive acquisition.
- Behavioral cohorts and user-level journey analysis
- Funnel analysis tied to revenue events
- Integrates with SaaS and e-commerce platforms
- Setup: days
Hotjar
Hotjar does not track revenue attribution. It diagnoses conversion friction through session replays, heatmaps, and funnel drop-off analysis. Used alongside an attribution tool, it explains why conversion rates differ across segments, which is a different but complementary question.
- Session replays and heatmaps
- Funnel drop-off analysis
- Integrates with GA4, HubSpot, and Segment
- Freemium entry; setup under one hour
Cyfe, Planful, Clicks Geek ROI Dashboard, and Lunio
These four tools occupy narrower niches. Cyfe aggregates metrics from 100+ services into simple dashboards for SMB teams that need consolidated visibility without engineering overhead. Planful serves finance and marketing teams that need budget reconciliation against financial reporting systems, with ERP and CRM integrations. Clicks Geek ROI Dashboard provides pre-built campaign-level ROI templates for teams that want fast ad performance visibility. Lunio offers simplified dashboard automation aimed at non-technical users who need reporting without a data team. None of the four provide deep attribution modeling; they are visibility and reporting tools.
How do you choose the right ROI tracking tool for your team?
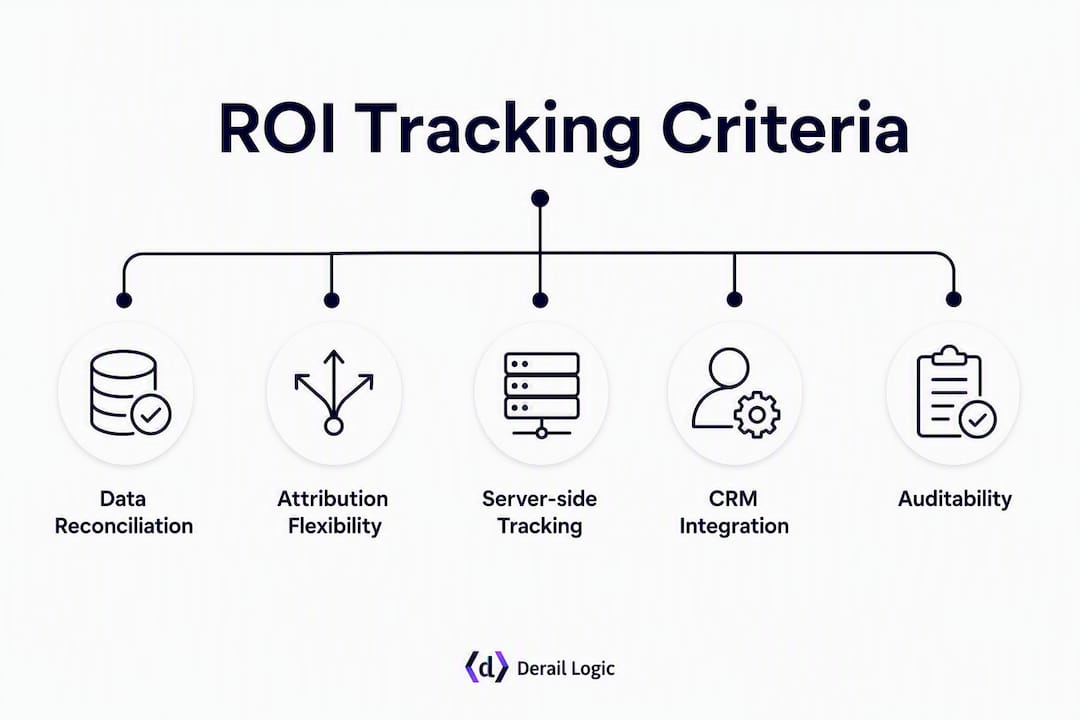
The decision comes down to five factors, in priority order.
1. Data reconciliation capability
Can the tool trace every reported metric back to a named source, a defined formula, and a recognized revenue event? An ROI dashboard that reconciles ad platforms, CRM, and billing produces an auditable number where ROAS, CAC, and LTV:CAC all trace to original sources. If a vendor cannot explain their reconciliation logic, that is a disqualifying red flag.

2. Attribution model flexibility
Different sales models need different models. DTC brands typically need last-click or blended multi-touch. B2B teams with long sales cycles need account-level, multi-touch influence modeling. Subscription businesses need LTV-aware attribution. A tool that only offers one model will distort your numbers for any channel that does not fit that model’s assumptions.
3. Server-side tracking support
Server-side tracking and conversion sync materially improve attribution accuracy when pixels are blocked or cookie-based signals degrade. Ask every vendor whether they support Conversion API patterns for Meta and Google. If they rely solely on client-side pixels, expect data loss as browser privacy controls tighten.
4. CRM and billing integration depth
Attribution tools that stop at the ad click miss the most important part of the revenue story. The tool needs to pull recognized revenue from your CRM or billing system, not just conversion events from your website.

5. Auditability and governance
Can you reproduce a reported number six months later? Can marketing and finance agree on the definitions used? Organizational alignment on metric definitions is as important as tool choice for producing defensible ROI reports.
Vendor demo questions to ask:
- Walk me through exactly how you calculate ROAS. What formula, what data sources, and what revenue event triggers the calculation?
- How does your tool handle a conversion that is touched by three different channels? Show me the attribution logic.
- Can you show me a reconciliation between your reported revenue and what appears in our CRM or Stripe?
- What happens to attribution data when a user switches devices or clears cookies?
- How do you handle offline conversions or phone-based sales?
- What is your data retention policy, and can we export raw event data?
- How long does a typical implementation take for a team our size, and what engineering resources do we need to provide?
Red flags to watch for:
- The vendor shows only platform-reported ROAS with no CRM reconciliation
- Attribution rules are not documented or are described as proprietary black boxes
- No server-side or Conversion API option
- No audit trail or data export capability
- Implementation requires months of custom engineering with no clear timeline
Scorecard template (copy to a spreadsheet):
| Criterion | Weight | Score (1–5) | Weighted Score |
|---|---|---|---|
| Attribution model flexibility | 20% | ||
| Server-side tracking support | 20% | ||
| Auditability and data export | 10% | ||
| Ease of setup / time to value | 5% | ||
| Pricing fit | 5% |
Score each vendor 1–5 per criterion, multiply by weight, and sum. Any tool scoring below 3.0 weighted average deserves a hard look before signing.
What does a defensible attribution pilot actually look like?
Getting the tool right is only half the work. The operational setup determines whether the numbers you produce are trustworthy enough for finance to act on.
Step-by-step data flow
-
Define your metrics first. Before connecting any tool, write down the exact formula for ROAS, CAC, and LTV:CAC your team will use. Get marketing and finance to sign off on the same definitions. This single step prevents more reconciliation disputes than any technology choice. A practical resource for getting those definitions right is the marketing analytics metrics guide from MartechAI.
-
Connect ad platforms via server-side or Conversion API. Client-side pixels alone will undercount conversions. Prioritize S2S connections for your highest-spend channels first.
-
Sync CRM deal stages to revenue events. Map the specific CRM stage or Stripe event that represents recognized revenue, not just a lead or a trial start.
-
Route data through a warehouse or governed layer. For teams with more than two or three data sources, a warehouse step prevents double-counting and makes reconciliation reproducible.
-
Set a reconciliation cadence. Weekly reconciliation between your attribution tool’s reported revenue and your CRM’s closed revenue catches drift before it compounds.
-
Validate before scaling. Run the full data flow on a single channel for 30 days. Compare the tool’s reported numbers against your CRM manually. Only expand to all channels once the single-channel numbers reconcile.
Implementation timeline by scenario
- DTC e-commerce (Shopify-native): 1–3 days for tag-and-connect integrations; 1–2 weeks to validate attribution against Shopify revenue
- B2B with a 60–90 day sales cycle: 3–6 weeks to map CRM deal stages, configure multi-touch attribution, and validate against closed-won revenue
- Agency managing multiple clients: 1–2 weeks per client for data connections; report automation setup adds another week
Pro Tip: The most common failure point is not the tool, it is the metric definitions. Teams that skip the governance step and jump straight to tool configuration spend weeks debugging numbers that are technically correct but commercially meaningless because marketing and finance are measuring different things. Write the definitions first, then connect the data.
The broader problem of AI and tool sprawl without connected data governance is well-documented: adding more tools without a governed data layer creates more noise, not more clarity.
What does ROI tracking software actually cost?
Pricing varies widely, and the sticker price rarely captures the full cost of ownership.
| Tier | Typical Monthly Range | Pricing Model | Typical Tools |
|---|---|---|---|
| Free/entry | — | Freemium or flat | GA4, Hotjar, Databox (free tier), Cyfe |
| Mid-market | $200–$1,500 | Per seat, per GMV, tiered by events | MartechAI, Cometly, Triple Whale, Ruler Analytics, Wicked Reports, Supermetrics, Whatagraph |
| Enterprise/custom | $2,000+ | % of ad spend, custom license, per MRR | Northbeam, Dreamdata, Hyros, Funnel.io, Planful, Rockerbox |
Hidden costs to plan for:
- Engineering hours for S2S setup: Server-side integrations typically require 10–40 hours of developer time per platform, depending on your stack
- Data warehouse costs: BigQuery, Snowflake, or Redshift add $50–$500/month depending on data volume
- Consulting and onboarding: Enterprise tools often charge $5,000–$20,000 for implementation consulting
- Ongoing maintenance: Attribution models need recalibration when you add channels or change your CRM structure
- Validation time: Budget two to four weeks of analyst time per quarter for reconciliation audits
Vendor onboarding time ranges from very quick tag-and-connect e-commerce integrations to much longer periods for enterprise reconciliation and warehouse governance. That range is not a vendor marketing claim; it reflects the genuine complexity difference between a Shopify pixel install and a multi-system warehouse governance project.
The basic ROI formula remains: (Revenue from campaign minus Marketing cost) divided by Marketing cost, multiplied by 100. However, practitioners increasingly prefer revenue-attribution methods that reconcile to recognized revenue rather than platform-reported conversion values, because the gap between those two numbers is where budget decisions go wrong.
Which tool should you actually choose?
The right answer depends on your sales model, your data maturity, and whether you need attribution or governance or both.
By buyer profile:
-
Teams wanting a unified platform (planning + execution + analytics): MartechAI is the strongest fit. It combines campaign studio, CRM, deep analytics, and governed metric definitions in one environment, reducing the reconciliation work that comes with multi-tool stacks. For SMBs and mid-market teams that cannot afford a dedicated data engineering team, that integration is the practical advantage.
-
Multi-channel advertisers with significant ad spend: Cometly or Northbeam. Cometly for teams that need server-side accuracy and fast AI-driven budget recommendations; Northbeam for brands spending at scale who need media mix modeling and incrementality testing.
-
Account-based B2B teams: Dreamdata or Ruler Analytics. Dreamdata for account-level influence modeling across buying committees; Ruler Analytics for teams that need closed-deal attribution tied to CRM outcomes with call tracking included.
-
DTC Shopify brands: Triple Whale for speed and Shopify-native creative analytics.
-
Subscription businesses: Wicked Reports for LTV-aware attribution across customer lifecycles.
-
Data teams building custom models: Supermetrics or Funnel.io as the pipeline layer, combined with GA4 for raw event data.
-
Finance-marketing reconciliation: Planful for teams that need budget reconciliation against financial reporting systems.
Pilot checklist:
- Connect one high-spend channel via server-side integration
- Map one CRM revenue event (e.g., closed-won deal or Stripe charge)
- Define ROAS and CAC formulas in writing before the pilot starts
- Run for 30 days, then manually reconcile the tool’s reported revenue against your CRM
- Measure: reconciliation gap (target under 5%), time to produce a weekly report, and whether finance accepts the numbers
30/60/90-day plan:
- Day 1–30: Single-channel pilot, metric definition sign-off, S2S setup for top channel
- Day 31–60: Expand to all major channels, warehouse connection if needed, first reconciliation audit
- Day 61–90: Full dashboard live, finance review, attribution model calibration, decision on long-term contract
For enterprise teams with complex attribution needs, the 90-day plan often extends to six months when warehouse governance and multi-system CRM mapping are involved.
Key Takeaways
The most defensible ROI tracking setup pairs a governed, reconciled data source with server-side event capture, and matches the attribution model to the actual sales cycle length.
| Point | Details |
|---|---|
| Reconciliation beats platform ROAS | Platform-reported ROAS is often inflated; reconcile to CRM-recognized revenue for numbers finance will trust. |
| Server-side tracking is now baseline | Client-side pixels miss conversions due to ad blockers and privacy controls; require S2S or Conversion API support from any tool you evaluate. |
| Match tool type to sales model | DTC brands need transactional attribution; B2B teams need account-level, multi-touch influence modeling; subscription businesses need LTV-aware attribution. |
| Governance precedes technology | Agreeing on metric definitions across marketing and finance before connecting any tool prevents more disputes than any platform feature. |
| MartechAI for unified teams | Derail Logic’s MartechAI combines campaign planning, CRM sync, and governed analytics in one platform, reducing reconciliation work for teams without dedicated data engineering. |
The gap between attribution tools and attribution discipline
Most attribution debates focus on which tool to buy. The harder conversation is whether the team has the operational discipline to make any tool produce trustworthy numbers.
Here is what gets overlooked: a $2,000/month attribution platform running on undefined metrics and unreconciled data sources will produce worse ROI numbers than a well-governed GA4 setup with a clear metric dictionary and a weekly reconciliation ritual. The tool is a multiplier. If the inputs are inconsistent, the outputs are confidently wrong, which is more dangerous than admitting you do not know.
The cultural alignment piece is also underestimated. Marketing teams tend to optimize for the metric that makes their channel look best. Finance teams want numbers that tie to recognized revenue. Those two perspectives produce different ROAS figures from the same underlying data, and no tool resolves that tension automatically. The resolution requires a shared definition document, a reconciliation owner, and a standing meeting where both teams review the same numbers. That infrastructure is invisible in most vendor demos, but it is what separates teams that trust their attribution from teams that argue about it every quarter.
The practical implication: before you sign a contract, run a one-week governance sprint. Write down your ROAS formula, your CAC formula, and the exact CRM event that counts as recognized revenue. Get sign-off from both marketing and finance. Then evaluate tools against that agreed framework, not against vendor benchmark claims.
MartechAI gives you governed analytics without the reconciliation overhead
Most teams evaluating ROI tracking tools end up managing three or four separate platforms: an attribution tool, a CRM, a reporting layer, and a campaign management system. The reconciliation work between those systems becomes a weekly tax on analyst time, and the numbers still do not always agree.
MartechAI, built on the Derail Logic platform, takes a different approach: campaign planning, CRM, deep analytics, SEO auditing, email marketing, and AI-driven insights are connected in one environment. Metric definitions are set once and applied consistently, so the ROAS your marketing team reports is the same number finance sees in the pipeline dashboard.
For teams that have spent time debugging attribution discrepancies between disconnected tools, that single-environment approach cuts reconciliation work significantly. The AI engine generates insights from your actual business data, not generic industry benchmarks, so recommendations reflect your specific channel mix and sales cycle.
MartechAI suits marketing teams, e-commerce businesses, and agencies that want a unified platform without building a custom data stack. A free trial is available, and the tiered subscription model means you can start at the feature set your team actually needs. To see how the platform handles attribution and analytics for your specific use case, start your free trial or request a demo directly from the platform page.
Useful sources and further reading
- Track Marketing ROI Across Platforms: 9 Best Tools — Cometly — Evaluates attribution accuracy, integrations, ease of setup, and pricing transparency across nine tools; useful for comparing server-side tracking capabilities.
- The Best Ad Tracking and Attribution Software — Hyros — Vendor page describing identity persistence and long-window attribution for complex funnels.
- Marketing Analytics Explained for Business Owners — MartechAI — Covers core analytics concepts and the importance of aligning marketing and finance on metric definitions.
- How to Align Marketing and Sales Campaign View — MartechAI — Practical guidance on campaign-level attribution and cross-team alignment.
- Why Analytics in Marketing Drives Better ROI — Babylove Growth: Third-party research on how analytics-driven approaches improve marketing ROI outcomes.
- AI Won’t Fix Marketing Tool Sprawl — Derail Logic: Explains why adding tools without data governance creates noise rather than clarity.
FAQ
How do you track ROI in marketing?
Calculate marketing ROI using the formula: (Revenue from campaign minus Marketing cost) divided by Marketing cost, times 100. For reliable results, reconcile the revenue figure to your CRM or billing system rather than relying on platform-reported conversions.
What is the highest ROI marketing channel?
SEO consistently shows the highest long-term channel ROI in multi-channel studies, though gains typically take 4–6 months to materialize. Paid search and email tend to show faster but lower long-term returns.
What is the best platform for tracking marketing performance?
The best platform depends on your sales model. MartechAI suits teams that want unified planning, CRM, and governed analytics in one environment. Cometly is stronger for multi-platform ad spend with server-side accuracy. Dreamdata leads for account-based B2B attribution. GA4 is the free baseline for event-level web analytics.
Why does platform-reported ROAS differ from my actual revenue?
Ad platforms claim full credit for conversions across channels, which causes double-counting when multiple platforms touch the same customer. Reconciling platform ROAS against CRM-recognized revenue typically reveals a meaningful gap, which is why governed attribution tools exist.
How long does it take to implement an ROI tracking tool?
Setup ranges from under an hour for tag-and-connect e-commerce integrations to several months for enterprise reconciliation and warehouse governance. A DTC Shopify integration typically takes one to three days; a B2B multi-system implementation with CRM mapping and warehouse governance takes three to six weeks or longer.