
Tracking marketing results is defined as connecting every dollar of marketing spend to a measurable business outcome, such as leads generated, deals closed, or revenue collected. Small businesses that master this connection make better budget decisions and grow faster than those running on instinct. The challenge is not a lack of data. It is too much of it. Knowing how small businesses track marketing results effectively comes down to one discipline: measuring a small number of metrics that directly influence decisions, then reviewing them on a fixed schedule.
What key metrics should small businesses track?
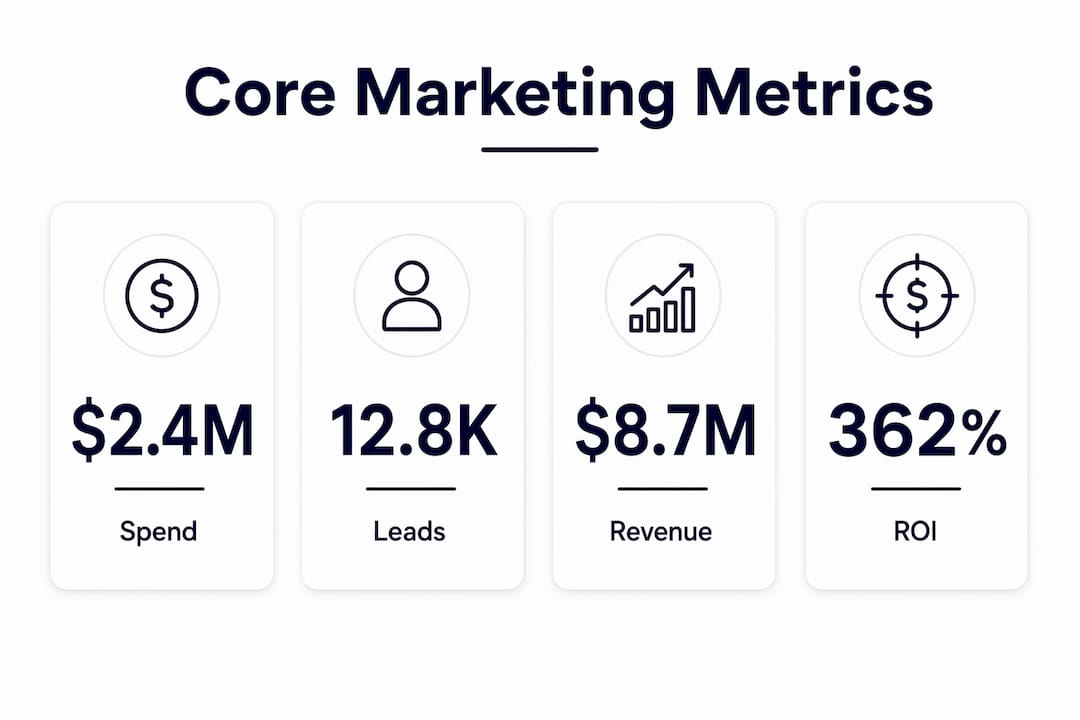
The five metrics every small business needs are monthly spend by channel, total leads generated, deals closed, revenue collected, and overall marketing ROI percentage. These five numbers fit on a single page and reveal performance patterns without requiring a data science background. That simplicity is the point.
Two additional metrics separate good tracking from great tracking: Customer Acquisition Cost (CAC) and the LTV:CAC ratio. CAC is calculated by dividing total marketing spend by the number of new customers acquired in the same period. The LTV:CAC ratio compares how much a customer is worth over their lifetime against what it cost to acquire them. A ratio above 3:1 generally signals a healthy marketing investment.
The table below summarizes the core metrics, how to calculate each one, and what a healthy result looks like.
| Metric | Calculation | Healthy benchmark |
|---|---|---|
| Marketing ROI | (Revenue from marketing – spend) ÷ spend × 100 | Positive and growing month over month |
| CAC | Total spend ÷ new customers acquired | Decreasing over time |
| LTV:CAC ratio | Customer lifetime value ÷ CAC | 3:1 or higher |
| Lead-to-close rate | Deals closed ÷ total leads × 100 | Improving quarter over quarter |
| Cost per lead | Total spend ÷ total leads | Decreasing as campaigns mature |
Vanity metrics, such as social media impressions, page views, and follower counts, do not belong in this core set. They feel good but rarely connect to revenue. Tracking too many metrics causes analysis paralysis. Small businesses make sharper decisions when they focus on 5–7 numbers that directly influence what to spend, cut, or test next.
Pro Tip: Build your one-page dashboard in a spreadsheet with one row per marketing channel. Update it every Monday morning for 10 minutes. That single habit will tell you more than any enterprise analytics platform.
Which tools do small businesses use to monitor results?
Simple tools work. A four-column spreadsheet updated weekly becomes the most valuable marketing document a small business owns. The columns are channel, spend, leads, and revenue. Everything else is secondary until you outgrow this format.
Beyond the spreadsheet, three tools fill the most common gaps:
- UTM parameters: Free tags added to URLs that tell Google Analytics exactly which campaign, channel, or ad drove a click. Without UTM parameters, traffic from email, social, and paid ads all shows up as “direct” in your analytics, making attribution impossible.
- Call tracking software: Local service businesses, such as plumbers, dentists, and contractors, generate most of their leads by phone. Call tracking tools assign a unique phone number to each marketing channel, so you know whether a caller found you through Google Ads, a yard sign, or a Facebook post.
- A basic CRM: Even a free CRM entry-level plan captures lead source, deal stage, and close date. That data closes the loop between a marketing click and actual revenue.
Avoid the trap of adopting enterprise-grade platforms before your tracking habits are solid. A complex dashboard with 40 data points creates noise, not clarity. Start with the spreadsheet, add UTM parameters, and layer in call tracking if phone leads are significant for your business. Check out top digital marketing trends to understand which tracking technologies are gaining traction in 2026 without overcomplicating your setup.
Pro Tip: Set up UTM parameters using Google’s free Campaign URL Builder. Name your campaigns consistently from day one. Inconsistent naming (e.g., “FB-Ad” vs. “facebook_ad”) fragments your data and makes channel comparison unreliable.

How often should you review your marketing data?
Consistent review schedules prevent the two most common small business mistakes: ignoring data entirely or reacting to every daily fluctuation. Weekly 15–20 minute reviews and monthly deeper reviews together create a rhythm that keeps decisions grounded in trends rather than gut feelings.
A practical review routine looks like this:
- Weekly (15–20 minutes): Pull your five core metrics from the spreadsheet. Flag any channel where spend increased but leads dropped. Note anything unusual but do not make permanent decisions based on one week of data.
- Monthly (60–90 minutes): Compare this month to last month and to the same month last year. Assess which channels are improving their cost per lead. Decide whether any channel deserves more budget or less.
- Quarterly (one focused session): Make exactly three strategic decisions: one channel or campaign to scale, one to cut, and one new tactic to test. This focused approach stops you from trying to fix everything at once.
Document every decision you make and why you made it. A simple notes column in your spreadsheet works fine. Six months later, that documentation tells you whether your reasoning was correct and teaches you how your specific market responds to marketing changes. That learning compounds over time in a way that no analytics tool can replicate on its own.
Pro Tip: Block your weekly review on your calendar as a recurring appointment. Treat it like a client meeting. Teams that skip this step consistently revert to gut-feel decisions within 60 days.
What advanced measurement concepts should small businesses know?
Measuring marketing effectiveness gets more complex as a business grows. The first challenge is distinguishing correlation from causation. Sales may rise the same week you run a Facebook campaign, but that does not prove the campaign caused the sales. Attribution modeling, marketing mix modeling, and incrementality testing each approach this problem differently and work best when used together.
Attribution modeling assigns credit for a conversion to one or more touchpoints in the customer journey. Last-click attribution, the default in most analytics tools, gives all credit to the final touchpoint before purchase. That model undervalues awareness channels like display advertising and social media. Multi-touch attribution distributes credit more fairly but requires more data and a CRM that captures every interaction.
Incrementality testing answers a sharper question: would this sale have happened without the marketing? Incremental ROAS measures whether sales occurred because of marketing, not just alongside it. This represents a meaningful shift away from cookie-dependent attribution models that are becoming less reliable as privacy regulations tighten.
The practical warning here is worth stating plainly. Tracking too many metrics leads to decision paralysis. As your measurement capability grows, resist the urge to track everything your tools can measure. Add a new metric only when you can answer this question: “What decision will I make differently based on this number?” If the answer is unclear, leave it out. Small businesses using attribution modeling tools can bring long sales cycles and multi-channel journeys into focus without building an in-house analytics team.
Key Takeaways
Effective small business marketing measurement requires five core metrics, a simple weekly tracking habit, and three focused quarterly decisions to connect spend directly to revenue.
| Point | Details |
|---|---|
| Focus on five core metrics | Track spend, leads, deals closed, revenue, and ROI to avoid analysis paralysis. |
| Use simple tools first | A weekly spreadsheet with UTM parameters outperforms complex platforms for most small businesses. |
| Review on a fixed schedule | Weekly 15–20 minute reviews and monthly deep dives keep decisions grounded in trends. |
| Make three quarterly decisions | Choose one channel to scale, one to cut, and one new tactic to test each quarter. |
| Separate correlation from causation | Use incrementality testing and attribution modeling to confirm marketing actually drives sales. |
Why simplicity is the real competitive advantage
I have worked with dozens of small business owners who believed their marketing was failing. When we sat down and built a basic tracking spreadsheet together, the real picture was almost always different from what they assumed. One local HVAC company was convinced their Google Ads were underperforming. Their spreadsheet revealed that Google Ads generated 60% of their closed deals at the lowest CAC of any channel. They had been considering cutting the budget entirely based on a feeling.
The mistake I see most often is not a lack of ambition. It is a lack of focus. Owners read about attribution modeling, incrementality testing, and marketing mix modeling, and they try to implement all three before they have a reliable weekly spreadsheet. That is like installing a commercial kitchen before you have learned to cook a consistent meal. The foundation has to come first.
My honest recommendation is this: commit to the five core metrics for 90 days before adding anything else. Document your decisions. Review weekly without exception. At the end of 90 days, you will have real data showing which channels work for your specific business in your specific market. That knowledge is worth more than any platform feature or advanced methodology. The businesses I have seen grow their marketing ROI most consistently are not the ones with the most sophisticated tools. They are the ones with the most disciplined habits.
— Zachary
Derail-logic makes marketing tracking less manual
Small business owners spend too much time pulling data from disconnected tools and not enough time acting on it. Derail-logic’s MartechAI platform connects your CRM, campaign data, and analytics into a single workflow so your weekly review takes minutes instead of hours.
The platform’s marketing automation features handle recurring data consolidation automatically, surfacing the metrics that matter without requiring manual exports. The visual campaign studio maps spend to outcomes by channel, and the built-in analytics dashboard tracks CAC, lead volume, and revenue in one place. For teams building a unified marketing stack, Derail-logic removes the “invisible waste” of manual data handling and keeps your focus on the three decisions that move the needle each quarter.
FAQ
What are the most important marketing metrics for small businesses?
The five core metrics are monthly spend by channel, total leads generated, deals closed, revenue collected, and overall marketing ROI percentage. These numbers connect marketing activity directly to business outcomes without requiring advanced analytics expertise.
How do small businesses track phone call leads from marketing?
Call tracking software assigns a unique phone number to each marketing channel, attributing offline leads accurately. Local service businesses that rely on phone inquiries miss a significant portion of their conversions without this tool in place.
How often should a small business review its marketing data?
Weekly 15–20 minute reviews catch short-term issues, while monthly deeper reviews assess channel performance trends. A quarterly session focused on three decisions, one to scale, one to cut, and one to test, keeps strategy on track.
What is incrementality testing and does a small business need it?
Incrementality testing measures whether sales occurred because of marketing, not just at the same time as marketing. Small businesses do not need it immediately, but it becomes valuable once basic tracking is solid and budget decisions involve multiple channels.
How many metrics should a small business track?
Focusing on 5–7 actionable metrics produces better decisions than tracking 40 or more. Every metric you add should answer a specific question that changes how you allocate budget or adjust campaigns.