
Campaign success measurement is defined as the practice of linking specific marketing activities to business outcomes, such as revenue, client retention, and pipeline growth, using agreed-upon key performance indicators (KPIs). Knowing how agencies measure client campaign success separates agencies that grow from those that churn clients. High-performing agencies maintain a delivery margin of 60–70% and a client retention rate exceeding 90% annually. They validate return on ad spend (ROAS) by connecting CRM-verified revenue directly to marketing spend. The measurement framework that works is not a single dashboard. It is a tiered system of executive KPIs, campaign diagnostics, and platform data, each serving a different audience and decision.
How agencies measure client campaign success: the KPI framework
Agencies that measure well start by separating primary KPIs from supporting metrics. Primary KPIs connect directly to client business goals. Supporting metrics explain why those goals were or were not met.
Primary KPIs agencies track:
- Client retention rate: The most telling long-term indicator. 7-figure agencies target 75–80%, while elite 8-figure agencies exceed 90%.
- Delivery margin: The percentage of revenue left after direct campaign costs. Healthy agencies hold this at 60–70%.
- ROAS (Return on Ad Spend): Calculated by dividing CRM-attributed revenue by total ad spend. Agencies that skip CRM linkage often overstate ROAS by counting assisted conversions twice.
- Revenue growth: Month-over-month or quarter-over-quarter revenue attributed to specific campaigns, verified through CRM data.
- Pipeline coverage ratio: Elite agencies maintain at least a 3:1 ratio, meaning $3 in qualified pipeline for every $1 of revenue target.
Secondary KPIs used as campaign health diagnostics:
- Click-through rate (CTR) and cost per click (CPC) signal creative and audience fit.
- Conversion rate by funnel stage reveals where prospects drop off.
- Cost per acquisition (CPA) versus target CPA shows budget efficiency.
Operational metrics like impressions and reach belong in a platform appendix, not in executive reporting. They describe activity, not impact. Treating them as success indicators is one of the most common measurement mistakes agencies make.
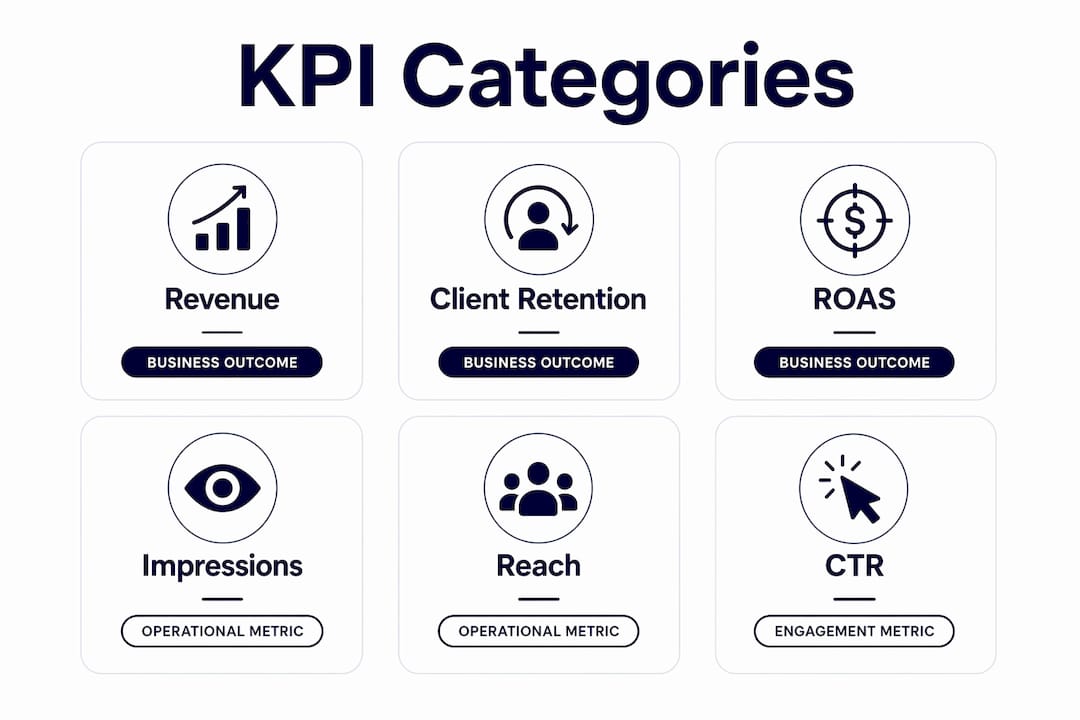
| KPI Category | Examples | Primary Purpose |
|---|---|---|
| Business outcome | Revenue, client retention, ROAS | Prove campaign value to leadership |
| Campaign diagnostic | CTR, CPA, conversion rate | Identify what is working or failing |
| Platform operational | Impressions, reach, frequency | Appendix reference only |

How do agencies prove true campaign impact beyond correlation?
Most agencies rely on last-click or multi-touch attribution models. These models show correlation, not causation. A customer who saw three ads before buying might have bought anyway. Incrementality testing answers the real question: did the campaign cause the result?
Incrementality testing compares a test group exposed to a campaign against a control group that was not. Randomized Controlled Trials (RCTs) in marketing work exactly this way. If the test group converts at 5% and the control group converts at 2%, the causal lift is 3 percentage points. That 3% is the number worth reporting to a client.
Geo holdouts work similarly. An agency runs a campaign in selected markets and withholds it from matched markets. Revenue differences between the two groups reveal true incremental impact. This method is especially useful for brand awareness campaigns where last-click attribution assigns zero credit.
The confidence thresholds agencies apply depend on funnel stage. Lower-funnel channels require 95% statistical confidence before scaling spend. Upper-funnel efforts, like awareness or consideration campaigns, can be evaluated at 50–60% confidence using leading indicators such as branded search volume or direct traffic lift. Applying a 95% threshold to upper-funnel work kills campaigns that are actually working.
Pro Tip: Run geo holdout experiments for at least four weeks before drawing conclusions. Shorter windows produce noisy data that leads to premature budget cuts.
Agencies that skip incrementality testing often waste budget on channels that appear to drive conversions but are actually capturing demand that would have converted regardless. Cart abandonment patterns illustrate this well. Retargeting ads frequently claim credit for purchases that were already in motion before the ad appeared.
How should agencies structure client reporting for clarity and trust?
The most effective client reporting follows a three-tier structure. Each tier serves a different reader with a different level of detail.
-
Tier 1: Executive summary. Two to four KPIs tied directly to client business goals. Revenue attributed to paid social, CPA versus target, and retention rate changes belong here. Reporting should always begin with business outcome metrics, not platform activity.
-
Tier 2: Campaign diagnostics. CTR, conversion rate by channel, CPA trends, and creative performance. This tier explains why Tier 1 numbers moved. A drop in CPA paired with rising CTR tells a clear story about creative improvement.
-
Tier 3: Platform appendix. Raw platform data including impressions, reach, and frequency. This tier exists for transparency, not decision-making. Clients who ask about impressions are often looking for reassurance. Tier 1 and Tier 2 data provide that reassurance more effectively.
Static monthly PDFs are the wrong format for modern agency reporting. Real-time dashboards give clients access to live performance data at any point in the month. This removes the anxiety that builds between reporting cycles and reduces the volume of ad hoc status requests agencies receive.
Pro Tip: Add a short narrative commentary block to every Tier 1 report. Flag one anomaly, explain its cause, and state what action the agency is taking. Clients remember narrative far longer than they remember tables.
Agencies that bury vanity metrics and lead with outcome-linked KPIs retain clients at higher rates. The reason is simple. Clients who understand the business impact of a campaign feel confident renewing. Clients who only see impressions and clicks feel uncertain about value.
What financial benchmarks define a high-performing agency?
Agency performance assessment goes beyond client-facing metrics. Internal financial benchmarks reveal whether the agency can sustain its delivery quality over time.
Delivery margin (60–70%) is the clearest indicator of operational health. An agency running below 60% is either underpricing, overstaffing campaigns, or both. An agency consistently above 70% may be underdelivering on scope.
Operating margin (EBITDA) of 25–35% signals that the agency generates enough profit to reinvest in talent, technology, and growth. Agencies below 20% EBITDA are often trapped in a cycle of winning new clients to cover the costs of existing ones.
Revenue per employee of $250,000–$350,000 is the benchmark for operationally efficient agencies. Below $200,000 per employee typically indicates scope creep, poor utilization tracking, or both. Utilization rate, the percentage of billable hours versus total available hours, should stay above 75% for delivery staff.
Client retention above 90% is the single most important long-term growth indicator. Acquiring a new client costs significantly more than retaining an existing one. Agencies that track retention monthly, not just annually, catch warning signs before a client decides to leave.
| Benchmark | Healthy Range | Elite Target |
|---|---|---|
| Delivery margin | 60–70% | 65–70% |
| Operating margin (EBITDA) | 25–35% | 30–35% |
| Revenue per employee | $200,000–$300,000 | $250,000–$350,000+ |
| Client retention rate | 75–80% | 90%+ |
| Pipeline coverage ratio | 2:1 | 3:1 |
Scoping accuracy is an underrated operational metric. Agencies that consistently deliver within 10% of scoped hours maintain healthier margins and stronger client relationships. Tracking scope variance by client and campaign type reveals which service lines are profitable and which are not.
Key Takeaways
Agencies that link every campaign metric to a client business outcome, apply incrementality testing by funnel stage, and report in a tiered structure retain clients at the highest rates and maintain the strongest margins.
| Point | Details |
|---|---|
| Lead with business outcomes | Start every client report with revenue, CPA, and retention metrics before any platform data. |
| Apply tiered KPI structure | Separate executive KPIs, campaign diagnostics, and platform appendix data for different audiences. |
| Use incrementality testing | RCTs and geo holdouts prove causal lift; confidence thresholds vary by funnel stage (95% lower, 50–60% upper). |
| Track internal benchmarks | Delivery margin of 60–70% and client retention above 90% are the clearest indicators of agency health. |
| Replace static reports with live dashboards | Real-time client access reduces anxiety and ad hoc status requests between reporting cycles. |
Why most agencies are measuring the wrong things
Agencies often build their measurement systems around what is easy to pull from a platform, not what actually answers the client’s business question. I have seen this pattern repeat across agencies of every size. The dashboard looks impressive. The client nods along. Then they do not renew.
The uncomfortable truth is that impressions, reach, and even CTR are comfort metrics. They give both the agency and the client something to point at without requiring anyone to answer the harder question: did this campaign generate revenue that would not have existed otherwise? That question requires CRM integration, incrementality testing, and honest conversations about attribution. Most agencies avoid all three because they are operationally harder to set up.
What actually builds long-term client relationships is transparency. Clients who can see live campaign data, understand why a metric moved, and trust that the agency will flag problems before they escalate are clients who renew. Agencies that use integrated campaign measurement to connect CRM revenue to marketing spend give clients that confidence. Agencies that send a PDF on the last day of the month do not.
My strongest recommendation: introduce incrementality testing in the first 90 days of a client engagement, not after a campaign underperforms. Proving causal lift early sets the measurement standard for the entire relationship. It also protects the agency when results are mixed, because you can show exactly what the campaign caused versus what would have happened anyway.
Aligning marketing and sales data is the infrastructure that makes all of this possible. Without it, you are reporting activity. With it, you are reporting impact.
— Zachary
How Derail-logic helps agencies measure what actually matters
Agencies that want to move from static reporting to live, outcome-linked measurement need a platform that connects every data source in one place.
Derail-logic’s Campaign Studio gives agencies a visual view of every active campaign, with performance data updating in real time. The built-in CRM links revenue directly to campaign activity, so ROAS calculations reflect actual closed deals, not estimated attribution. The Autopilot AI feature surfaces anomalies before they become problems, flagging budget pacing issues, creative fatigue, and conversion rate drops without waiting for a monthly review. Agencies using Derail-logic’s marketing automation tools replace manual reporting cycles with live dashboards that clients can access anytime, reducing status requests and building the kind of transparency that drives retention above 90%.
FAQ
What KPIs do agencies use to measure client campaign success?
Agencies prioritize revenue growth, ROAS, CPA versus target, and client retention rate as primary KPIs. CTR, conversion rate, and CPC serve as secondary diagnostics that explain why primary metrics moved.
What is incrementality testing in marketing?
Incrementality testing compares a group exposed to a campaign against a control group that was not, using RCTs or geo holdouts to measure causal lift. It proves whether a campaign drove results or simply captured demand that already existed.
What is a good client retention rate for an agency?
Elite agencies exceed 90% annual client retention. Seven-figure agencies typically target 75–80%. Retention above 90% is the clearest signal that an agency delivers consistent, measurable value.
How should agencies structure client reports?
Effective reports use three tiers: executive KPIs tied to business goals, campaign diagnostics explaining performance, and a platform data appendix for transparency. Tiered reporting improves client understanding and reduces churn.
What delivery margin should agencies target?
A healthy delivery margin sits between 60–70%. Margins below 60% signal underpricing or overstaffing. Margins above 70% may indicate underdelivery on agreed campaign scope.