
Content performance measurement is the process of selecting and analyzing specific metrics that align directly with a content piece’s goal to evaluate its real impact. Most creators track the wrong numbers. They watch follower counts climb while revenue stays flat, or celebrate viral reach while email signups stagnate. The industry term for this structured approach is content analytics, and it requires matching each metric to the job the content was built to do. This guide covers the frameworks, platform signals, and operational habits that separate creators who grow from those who just post.
How creators measure content performance: the core frameworks
The most effective measurement system starts with a question: what was this content supposed to do? Creators match performance metrics to the content’s intended purpose instead of applying a single metric set to every post. Reach-oriented content gets judged by views, shares, and new followers. Trust-focused content earns its score through saves, comments, and retention. Revenue-driving content lives or dies by clicks, conversions, and sales.
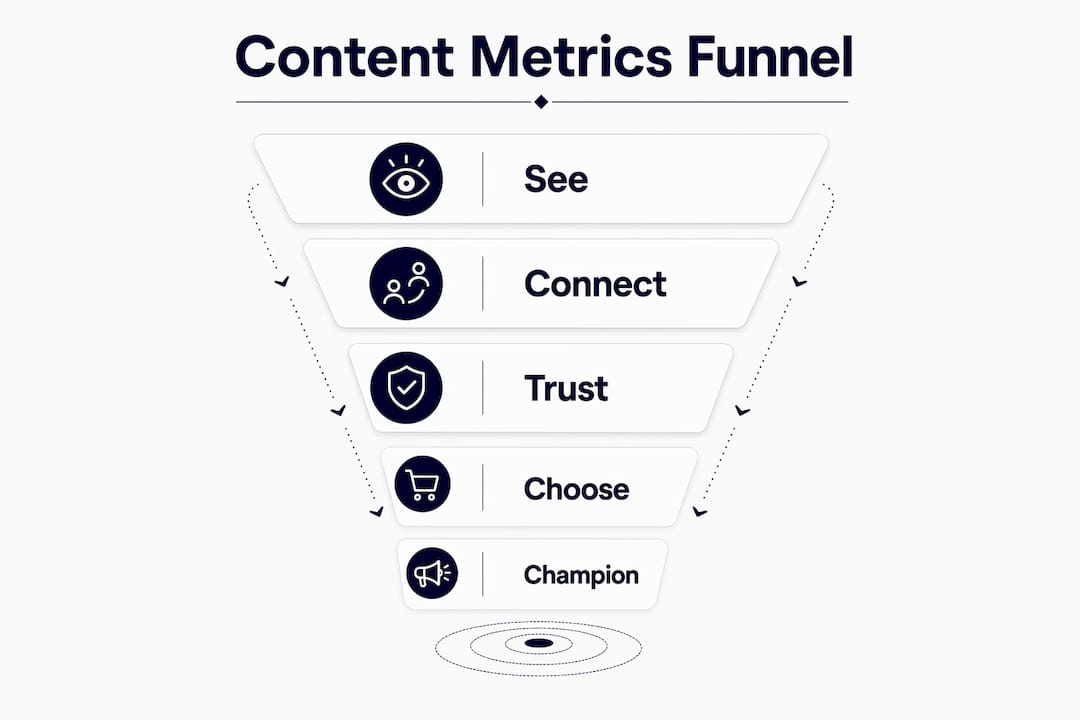
A widely used structural model is the 5-stage content funnel: see, connect, trust, choose, and champion. Each stage carries its own KPI set. “See” tracks impressions and reach. “Connect” measures engagement rate and click-through rate. “Trust” looks at return visits, time on page, and saves. “Choose” captures conversions and revenue. “Champion” monitors shares, referrals, and brand mentions. This model prevents creators from judging a trust-building article by its conversion rate, which is a category error that kills good content strategies.

Surface metrics like reach and impressions are not useless. They tell you whether distribution is working. The problem is stopping there. Measuring only surface metrics misses the depth of a content piece’s contribution across the audience journey. A blog post with modest reach but high save rate and strong organic ranking is outperforming a viral post with zero downstream action.
Pro Tip: Build a simple content log with four columns: content job, format, primary KPI, and result. Review it monthly. Patterns appear faster than you expect.
UTM parameters are the operational backbone of accurate measurement. Every link you share should carry a UTM source, medium, and campaign tag. Without them, GA4 groups a significant portion of your traffic under (direct)/(none), which tells you nothing about what content drove the visit.
| Content job | Primary KPI | Secondary KPI |
|---|---|---|
| Awareness | Reach, new followers | Impressions |
| Trust building | Saves, comments, retention | Return visits |
| Conversion | Click-through rate, sales | Cost per acquisition |
| Loyalty | Shares, referrals | Brand mentions |
Which metrics matter most on key digital platforms?
Platform algorithms do not reward popularity. They reward relevance signals, and the strongest relevance signal on video platforms is watch time. Retention and completion rates are primary algorithmic signals on short-form video platforms, consistently outweighing likes and comments in distribution decisions.
The benchmarks differ by platform. TikTok’s completion threshold sits at 70% or above. YouTube targets 50% or higher audience retention as a healthy signal. Instagram Reels prioritizes watch time and direct message shares over public engagement. These numbers matter because the algorithm uses them to decide whether to push your content to new audiences. A video with 10,000 views and 80% completion will reach more people next week than one with 50,000 views and 20% completion.
Saves and shares carry a different weight than likes. A like takes one tap and signals mild approval. A save signals that the viewer found the content worth returning to. A share signals that they trust it enough to put their name behind it. Both are stronger endorsements than a comment, which can be as shallow as a single emoji. For creators working with brand partners, engagement rate variations across content types directly affect partnership valuations and renewal decisions.
- Watch time and completion rate: Primary distribution signals on TikTok, YouTube, and Instagram Reels
- Saves: Indicate high-value, reference-worthy content; strong trust signal
- Shares and DM forwards: Show the audience endorses the content publicly or privately
- Comments with substance: Multi-word replies indicate real engagement, not passive scrolling
- Click-through rate: Measures whether content drives the audience off-platform to take action
Shopify categorizes content metrics into engagement, SEO, and conversion buckets, each tailored to the channel. For blogs, organic traffic and search rankings define success. For social, the engagement rate is the primary signal. For conversion-focused content, click-through rate and return on investment take priority. Applying the wrong bucket to the wrong channel produces misleading conclusions.
How to connect content metrics to real business outcomes
Most creators drown in dashboards. The fix is not more data. It is fewer, better-chosen KPIs. Limiting KPIs to 1–2 per funnel lane and reviewing them on a consistent cadence is the key to turning measurement into decisions. Monitoring five lanes weekly, including reach, engagement, authority, conversion, and efficiency, gives you a complete picture without creating analysis paralysis.
The review cadence matters as much as the metrics themselves. Weekly reviews surface decisions: which content to boost, which format to pause, which topic to repeat. Monthly reviews reveal trends: whether your audience is growing, whether trust signals are strengthening, whether content is contributing to pipeline. Mixing these two timeframes into one undifferentiated review session produces confusion, not clarity.
Here is a practical system for linking metrics to outcomes:
- Define the content job before publishing. Write it in one sentence: “This post builds trust with first-time visitors by explaining how attribution works.”
- Assign one primary KPI per job. Trust content gets saves and return visits. Conversion content gets click-through rate and form fills.
- Set a baseline. Pull your last 10 posts of the same type and calculate the average for your chosen KPI. That is your benchmark.
- Review weekly for decisions. If a post underperforms its benchmark by more than 30%, investigate the hook, format, or distribution channel.
- Review monthly for trends. Look for patterns across content jobs. If trust content consistently outperforms conversion content, your audience may need more nurturing before you push offers.
Pro Tip: Run a UTM audit every quarter. Pull your GA4 source/medium report and check what percentage of sessions show as (direct)/(none). If it exceeds 20%, your tagging is broken and your attribution data is unreliable.
Poor UTM hygiene causes 20–40% of sessions to lose source and medium clarity in GA4. That is not a minor inconvenience. It means a significant share of your content-driven traffic is invisible in your reports, and decisions made on that data are built on a flawed foundation.
What practical steps can creators take to analyze content success?
Tracking post metadata is the most underused habit in content analytics. Logging topic, format, post date, and content job for every piece of content creates a searchable record that reveals patterns over time. After 60 posts, you can sort by format and see whether carousels outperform single images for trust content. After 90 posts, you can sort by topic and see which themes drive the most saves.
Retention curves are diagnostic tools, not just performance scores. Early drop-off in a video signals a hook problem. The first three seconds did not earn the next 30. Drop-off in the middle of a video signals a pacing or structure problem. The content earned attention but lost it through repetition or poor sequencing. Drop-off near the end is usually acceptable. Knowing which problem you have tells you exactly what to fix, rather than guessing whether to change the topic, the thumbnail, or the script.
- Build a content log: Record content job, format, topic, and primary KPI result for every post
- Read retention curves by segment: Separate early, mid, and late drop-off for targeted edits
- Avoid vanity metric traps: Job-to-KPI mapping keeps reporting focused on whether content fulfilled its purpose
- Connect platform analytics to Google Analytics: Use UTM parameters to trace social content to website behavior and conversions
- Run quarterly UTM audits: Check GA4 for (direct)/(none) inflation and fix broken tags before they corrupt trend data
The goal of content analytics is not to produce reports. It is to produce better content faster. Every insight should connect to a specific edit, format change, or topic decision. If a metric does not change what you do next, it is not worth tracking.
Key Takeaways
Effective content measurement links each metric to the specific job a piece of content was built to do, then reviews those metrics on a consistent weekly and monthly cadence to drive real decisions.
| Point | Details |
|---|---|
| Match metrics to content job | Assign reach metrics to awareness posts, saves and retention to trust content, and conversions to revenue posts. |
| Use the 5-stage funnel model | Track see, connect, trust, choose, and champion stages with distinct KPIs to avoid category errors. |
| Prioritize watch time over likes | Completion rate and watch time drive algorithmic distribution on TikTok, YouTube, and Instagram Reels. |
| Limit KPIs per funnel lane | Use 1–2 KPIs per stage and review weekly for decisions, monthly for trends, to avoid dashboard overload. |
| Fix UTM hygiene regularly | Audit GA4 quarterly to catch (direct)/(none) inflation that hides content-driven traffic from your reports. |
Why most creators are measuring the wrong things
I have reviewed content dashboards for teams ranging from solo creators to 20-person marketing departments, and the same problem appears every time. The dashboard is full. The decisions are empty. Creators track 15 metrics because the platform offers 15 metrics, not because 15 metrics are useful. The result is a weekly ritual of screenshot-taking that produces no change in content strategy.
The creators who actually improve are the ones who build what I call a minimal viable measurement system. They pick one KPI per content job, review it on a fixed schedule, and act on what they find. They do not chase the metric that looks best in a brand pitch deck. They chase the metric that proves the content did its job.
The operational challenge nobody talks about is UTM consistency at scale. When you are publishing across four platforms, running paid amplification, and collaborating with a team, UTM tags get skipped, duplicated, or mislabeled. The connected marketing systems that enforce tagging rules at the workflow level prevent this invisible waste from corrupting your attribution data. Without that infrastructure, your monthly trend reports are partly fiction.
The best content creators I have worked with treat analytics as a feedback loop, not a report card. They look at retention curves the way a film editor looks at a rough cut. Every drop-off is a note. Every spike is a signal. The data tells them where the audience’s attention went, and they use that information to make the next piece sharper.
— Zachary
Derail-logic makes content measurement less fragmented
Content analytics breaks down when your data lives in five different places. Platform dashboards, GA4, your CRM, your email tool, and your campaign planner each hold a piece of the picture, and assembling them manually is slow and error-prone.
Derail-logic’s marketing automation platform connects your content performance data to your campaign workflows, CRM, and attribution reporting in one place. The AI Engine pulls from multiple live data sources to surface content insights before you go looking for them. The Campaign Studio maps content performance to pipeline stages, so you can see which pieces are actually moving the audience from awareness to conversion. If you are ready to replace fragmented reporting with a connected measurement system, Derail-logic is built for that.
FAQ
What does content performance measurement mean?
Content performance measurement is the practice of selecting specific metrics tied to a content piece’s goal and analyzing them to evaluate real impact. It differs from general analytics by requiring that each metric maps to a defined content job.
Which metrics matter most for video content?
Watch time and completion rate are the primary signals on TikTok, YouTube, and Instagram Reels. Platforms use these metrics to decide how widely to distribute a video, making them more important than likes or comments.
How many KPIs should a creator track per content piece?
The most effective approach limits tracking to 1–2 KPIs per funnel stage. More than that creates reporting noise and slows down decision-making without improving content quality.
Why does UTM tagging affect content performance data?
Inconsistent or missing UTM tags cause GA4 to group traffic under (direct)/(none), hiding the true source of visits. Audits show that 20–40% of sessions can lose source clarity due to poor tagging practices.
What is the difference between a vanity metric and a useful metric?
A vanity metric looks good but does not prove the content fulfilled its purpose. A useful metric directly reflects whether the content achieved its intended job, such as saves for trust content or conversions for revenue content.