



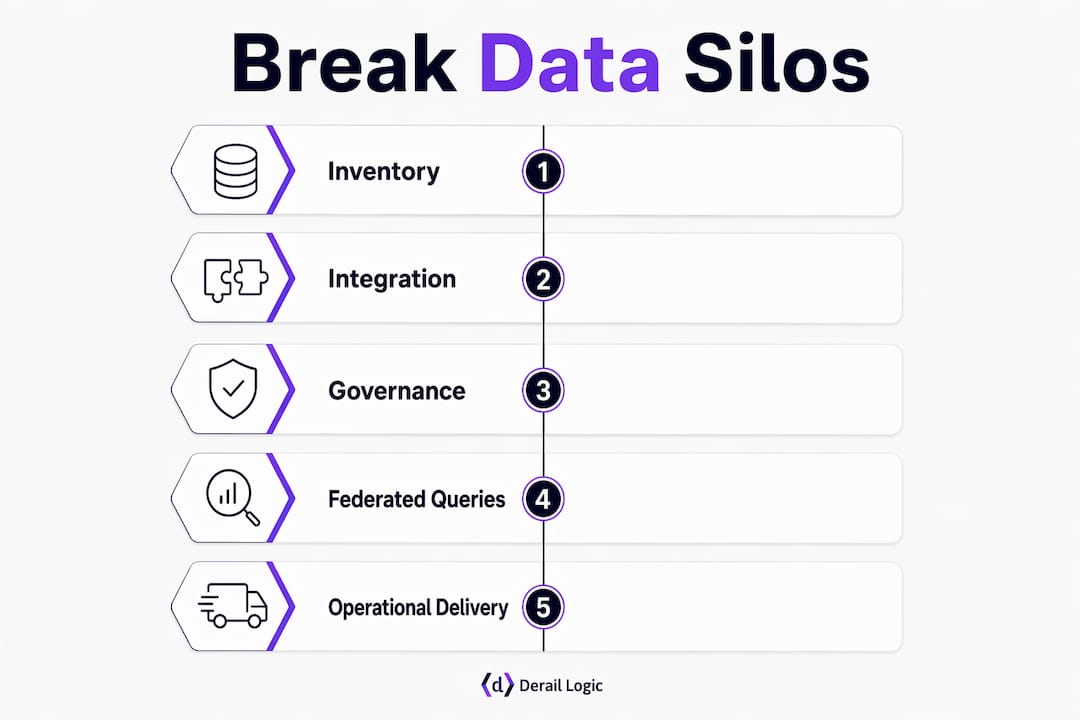
To eliminate data silos in your marketing team, start with three moves in this order: (1) run a short data inventory to identify every active source and lock a single source of truth for campaign performance; (2) build integration-first pipelines for your two or three highest-value sources and use federated queries for ad-hoc or low-frequency sources; (3) assign governance roles and establish shared KPIs with finance. The order matters because you cannot integrate what you have not mapped, and governance without data flowing is just policy on paper.
Days 0–14 quick action plan:
- Days 0–3: Schedule 30-minute discovery calls with every channel owner (paid, email, CRM, web analytics, ecommerce). Ask: what system, who owns it, how often it refreshes, and what metrics it tracks.
- Days 4–10: Run a shadow-IT scan. Pull a list of active SaaS subscriptions and ad-hoc spreadsheets. Flag any source that feeds a campaign decision but sits outside your main stack.
- Days 11–14: Draft your data inventory table (system, owner, refresh cadence, critical metrics, access requirements). Assign a data steward to each source and schedule a governance kickoff.
Table of Contents
- What are data silos, and why do they hurt marketing teams?
- Why data silos form inside marketing teams
- How marketing data silos hurt performance and budget decisions
- What are the core strategies to break down marketing data silos?
- How to run a 7–14 day marketing data inventory
- How do you choose the right architecture to unify marketing data?
- What does a realistic implementation timeline and cost look like?
- How do you measure progress when removing marketing data silos?
- A 90–180 day rollout checklist for marketing leaders
- How MartechAI addresses marketing data silos
- Key takeaways
- What most guides get wrong about breaking down data silos
- MartechAI gives marketing teams a faster path to unified data
- Research and further reading
- FAQ
What are data silos, and why do they hurt marketing teams?
A marketing data silo is a dataset controlled by one channel, tool, or team that other parts of the marketing function cannot access or combine with their own data. The result is fragmented analysis and decisions made on incomplete information.
Two examples marketing leaders recognize immediately: your CRM holds lead-to-revenue records, but your paid media platform tracks conversions with its own attribution model, and the two numbers never reconcile. Or your campaign analytics live in one dashboard while conversion data sits in a spreadsheet someone updates manually on Fridays. Neither team is wrong; the data is just isolated.
One clarification worth making: data silos are not the same as access controls. A compliance-gated dataset that only certain roles can view is a deliberate governance decision. A silo is isolation by accident, organizational friction, or technical debt, not by design.
Why data silos form inside marketing teams
Silos rarely appear because someone decided to hoard data. They form through a combination of speed pressure, tool sprawl, and misaligned incentives.
Common causes:
- Channel-driven stacks: Each channel team (paid search, social, email, SEO) adopts the tool that best fits their workflow, and those tools rarely share a common schema.
- Reporting urgency: Campaign deadlines push teams to build quick, local workarounds rather than wait for a central pipeline. Those workarounds calcify into permanent processes.
- Shadow IT: Ad-hoc Snowflake or BigQuery instances get spun up by a data-savvy analyst, then never documented or connected to the broader stack.
- API and schema churn: Platform APIs change frequently. Hand-coded pipelines break, get patched locally, and diverge from the canonical data model.
- Incentive misalignment: Speed is rewarded; consolidation is not. A channel manager who hits their ROAS target has little reason to spend time on cross-team data alignment.
- No shared metric definitions: “Conversion” means something different in Google Ads, Salesforce, and your email platform. Without a semantic layer, every team reports a different number.
Pro Tip: Before you build a pipeline for a new source, ask how often you actually query it. If the answer is “monthly for a one-off report,” federated analysis is almost always cheaper and faster than a full ETL pipeline — which can take 2–6 weeks to build and requires ongoing maintenance.
How marketing data silos hurt performance and budget decisions
82% of enterprises report that data silos disrupt critical workflows. For marketing teams, that disruption shows up in three specific ways.
82% of enterprises say data silos disrupt critical workflows — and for marketing teams, the cost shows up as broken attribution, wasted spend, and hours of manual reporting every week.
- Broken attribution: When your CRM and ad platform use different conversion windows and different identity resolution methods, you cannot tell which channel actually drove revenue. Budget decisions default to the loudest channel, not the most effective one.
- Wasted ad spend: Without a unified view, you cannot suppress converted customers from acquisition campaigns or cap frequency across channels. That is invisible waste — money spent on people who already bought.
- Manual reporting hours: Analysts spend hours each week pulling exports, reconciling numbers, and building one-off dashboards. That time does not produce insight; it produces a spreadsheet that is already stale.
Only a small share of advertisers use shared KPIs with finance, which creates measurement gaps that make it harder to justify marketing investment to a CFO. Fixing that gap is one of the fastest ways to build executive support for a data unification project.
What are the core strategies to break down marketing data silos?
Four complementary strategies cover the full range of silo problems: governance, integration-first pipelines, federated analysis, and operational delivery. No single approach handles every case; the right mix depends on your team’s size, cadence, and engineering capacity.
Governance
What it is: Defined ownership, shared metric definitions, and a data stewardship model. When to use it: Always, as the foundation for every other strategy. Starter action: Assign a data steward to each of your core sources and publish a shared metric glossary (what “lead,” “conversion,” and “attributed revenue” mean in your stack).
Integration-first pipelines
What it is: Raw data is stored centrally and transformed at read time rather than at ingestion. This integration-first approach gives your team flexibility to answer new questions without rebuilding pipelines. When to use it: For high-frequency sources (daily or more) that feed core dashboards. Starter action: Pick your two highest-value sources (usually CRM and web analytics) and build raw-store connectors before adding any transformation logic.

Federated analysis
What it is: Queries run against data in place across different systems. Federated analysis answers ad-hoc cross-source questions without building permanent ETL pipelines. When to use it: For low-frequency or exploratory queries where the cost of a pipeline is not justified. Caveat: It adds query-time coordination overhead and requires driver and credential setup for each source.
Operational delivery (reverse ETL)
What it is: Unified data is pushed back into the tools marketers use every day — CRM, ad platforms, email systems. Without this last mile, clean data never reaches the teams that need it. When to use it: Once your pipeline is stable and you want to activate unified audiences or suppress converted customers in real time. Starter action: Identify one high-value sync (e.g., CRM segments to your ad platform) and automate it before expanding.
Strategy selection checklist for next quarter:
- High-frequency source feeding a core dashboard → integration-first pipeline
- Ad-hoc or monthly exploratory query → federated analysis
- Unified data needs to activate in a campaign tool → reverse ETL
- Multiple teams reporting different numbers for the same metric → governance first
Pro Tip: Combine ETL pipelines for your two or three highest-frequency sources with federated queries for exploratory analysis. You get speed where it matters and flexibility where you need it, without over-engineering the stack.
How to run a 7–14 day marketing data inventory
Most marketing teams manage several core data sources that require integration. The inventory exercise maps those sources before you build anything.
Step-by-step plan:
- Days 1–2 (discovery calls): Meet with each channel owner. Capture system name, owner, refresh cadence, critical metrics, and access requirements. Use the template below.
- Days 3–5 (shadow-IT scan): Pull your SaaS subscription list and ask each team for any spreadsheets or ad-hoc databases feeding campaign decisions. Add every finding to the inventory.
- Days 6–9 (schema capture): For each source, document the key fields and how they map to your shared metric definitions. Flag schema mismatches (e.g., “session” in GA4 vs. “visit” in your CRM).
- Days 10–12 (ownership map): Assign a data steward and an escalation contact to each source. Note any compliance or consent requirements.
- Days 13–14 (prioritization): Score each source on value (how many decisions depend on it) and integration effort (API stability, data volume, schema complexity). Pipeline the top two first.
Data inventory template:
| Field | What to capture |
|---|---|
| System name | Platform or tool name (e.g., Salesforce, GA4, Meta Ads) |
| Owner | Team and named individual responsible |
| Refresh cadence | Real-time, daily, weekly, or manual |
| Critical metrics | The 3–5 metrics this source owns |
| Access requirements | API key, OAuth, compliance gate, or manual export |
| Schema notes | Key field names and known mismatches |
| Integration priority | High / Medium / Low (value-to-effort score) |
Common core sources include CRM (Salesforce, HubSpot), web analytics (GA4), paid media (Google Ads, Meta Ads), email platform, ecommerce or product database, customer data platform or data warehouse, marketing automation, and customer support data. Not every team has all, but most have multiple.
How do you choose the right architecture to unify marketing data?
The decision comes down to five criteria: time-to-value, maintenance cost, governance requirements, real-time needs, and whether you need to handle unstructured data. A data lakehouse with unified governance makes it easier to enable analytics and AI across previously siloed datasets, but it is not the right starting point for every team.

| Architecture pattern | Best for | Pros | Cons |
|---|---|---|---|
| Integration-first warehouse + reverse ETL | Teams with 3+ high-frequency sources and engineering support | Flexible, scalable, supports AI/ML | Higher setup cost; requires data engineering |
| Customer data platform (CDP) | Teams needing real-time identity resolution and audience activation | Fast time-to-value; built-in consent management | Vendor lock-in; limited for complex analytics |
| iPaaS (integration platform as a service) | Teams connecting SaaS tools without custom code | Low-code; fast connector setup | Less control over data model; can get expensive at scale |
| Federated query layer | Teams with low-frequency cross-source questions | No data movement; low setup cost | Slower query performance; credential management overhead |
Decision flow:
- Small team, limited engineering, SaaS-heavy stack → iPaaS or CDP
- Mid-size team, multiple high-frequency sources, analytics-first → integration-first warehouse
- Large team, complex attribution, AI use cases → lakehouse + reverse ETL
- Any team, exploratory or monthly queries → add a federated layer on top of your primary architecture
For teams reducing tool sprawl, the all-in-one platform approach can cut both maintenance overhead and the number of integration points you need to manage.
What does a realistic implementation timeline and cost look like?
A staged rollout across several months is realistic for most marketing teams. Trying to unify everything at once is the most common reason projects stall.
Phase breakdown:
- Discovery (Days 1–14): Complete the data inventory, assign stewards, and score sources by priority. Deliverable: a signed-off inventory table and a prioritized source list. Effort: a few engineer-weeks plus stakeholder time.
- Pilot (Days 15–75): Build connectors for the top two sources, stand up a raw-store layer, and deliver one unified dashboard. Deliverable: a working pilot with documented accuracy thresholds. Effort: several engineer-weeks depending on API complexity.
- Expand (Days 76–180): Add remaining sources, build the semantic layer, enable reverse ETL for one operational sync, and train the team. Deliverable: full coverage of your 6–8 core sources with governance documentation. Effort: multiple engineer-weeks.
Ballpark cost ranges:
- Low (iPaaS or CDP, limited engineering): primarily vendor subscription costs, minimal custom development
- Medium (integration-first warehouse, moderate engineering): vendor subscriptions plus 4–8 weeks of engineering time
- High (lakehouse, custom pipelines, AI layer): significant engineering investment plus ongoing maintenance
Common risk points:
- API deprecations mid-project (mitigate by building abstraction layers early)
- Schema changes from a platform update breaking a connector (mitigate with automated schema drift alerts)
- Stakeholder sign-off delays on governance roles (mitigate by getting executive sponsorship before Day 1)
- ETL pipeline setup taking longer than estimated, which compresses the pilot timeline.
How do you measure progress when removing marketing data silos?
Progress is measurable from Day 1 if you instrument the right KPIs. The goal is not just technical connectivity; it is faster, more confident decisions.
| KPI | How to measure | Cadence |
|---|---|---|
| % of campaign metrics in a single view | Count metrics available in unified dashboard vs. total tracked | Weekly during pilot; monthly after |
| Time-to-answer for cross-channel questions | Track time from question asked to verified answer | Per sprint or bi-weekly |
| Reduction in manual reporting hours | Log analyst hours before and after integration | Monthly |
| Shared KPI adoption rate | % of teams using the canonical metric glossary | Monthly |
| Data freshness score | % of sources refreshing within their SLA window | Daily |
For a practical view of what unified reporting looks like in practice, integrated dashboard examples can help you set acceptance criteria for your pilot.
Five operational monitoring checks to run weekly:
- Data freshness: Are all connectors delivering within their expected refresh window?
- Connector failure alerts: Do you have automated alerts for failed API calls or broken syncs?
- Schema drift detection: Are any upstream schema changes breaking downstream queries?
- Access audits: Are data steward assignments current, and are access permissions still appropriate?
- Lineage coverage: Can you trace every metric in your unified dashboard back to its source system?
Unified marketing analytics metrics become far more reliable once these checks are in place, because you catch data quality issues early.
A 90–180 day rollout checklist for marketing leaders
This checklist is role-aware. Assign each milestone before the project starts so there is no ambiguity about who owns what.
Weeks 1–2 (Discovery):
- Complete data inventory with all channel owners. Owner: Marketing Ops lead. Acceptance: all 6–8 sources documented with stewards assigned.
- Run shadow-IT scan and add findings to inventory. Owner: Marketing Ops + IT. Acceptance: no undocumented sources feeding campaign decisions.
- Hold governance kickoff. Agree on shared metric definitions and escalation paths. Owner: CMO or VP Marketing. Acceptance: signed-off metric glossary.
Weeks 3–10 (Pilot):
- Build connectors for top two sources. Owner: Data engineer or iPaaS admin. Acceptance: raw data flowing with <1% error rate.
- Stand up unified dashboard for pilot team. Owner: Analytics lead. Acceptance: dashboard parity with existing channel reports within 5% variance.
- QA data accuracy against source systems. Owner: Data steward + channel owner. Acceptance: reconciled numbers documented.
Weeks 11–26 (Expand):
- Add remaining core sources. Owner: Data engineer. Acceptance: all 6–8 sources connected and monitored.
- Build semantic layer (shared metric definitions applied at query time). Owner: Analytics lead. Acceptance: all teams pulling from canonical definitions.
- Enable reverse ETL for one operational sync (e.g., CRM segments to ad platform). Owner: Marketing Ops. Acceptance: automated sync running with suppression lists active.
- Train all channel teams on unified dashboard and governance process. Owner: Marketing Ops lead. Acceptance: >80% of channel owners using shared dashboard for weekly reporting.
Role assignment matrix:
- Discovery ownership: Marketing Ops lead
- Governance sign-off: CMO or VP Marketing
- Connector operations: Data engineer or iPaaS admin
- Data accuracy verification: Data steward (per source) + channel owner
- Training and adoption: Marketing Ops lead
How MartechAI addresses marketing data silos
MartechAI, Derail Logic’s marketing platform, addresses the key failure modes marketing teams face when unifying data: fragmented campaign visibility, disconnected CRM and analytics, and the absence of a delivery layer that pushes clean data back into operational tools.
Feature-to-problem map:
- Visual campaign studio: Replaces the spreadsheet-and-dashboard patchwork that creates reporting silos. All campaign planning and performance data lives in one place.
- Intelligent CRM: Connects lead and customer records directly to campaign data, closing the gap between CRM-derived attribution and ad platform conversions.
- Deep analytics and unified dashboard: Surfaces cross-channel performance in a single view, reducing the time-to-answer for cross-channel questions from hours to minutes.
- AI Engine: Queries multiple live data sources to surface insights without requiring manual exports or custom queries. Relevant for teams using federated analysis patterns.
- Consent management integration: Treats compliance as foundational, not an afterthought, which reduces rework when privacy requirements change.
- Marketing automation connectors: Deliver unified data back into operational workflows, the reverse ETL function that prevents re-fragmentation after integration.
Before/after example (anonymized structure):
A mid-size B2B marketing team was running paid media, email, and CRM as three separate reporting streams. Attribution reconciliation took two analysts roughly four hours every Monday. After connecting all three sources through a unified dashboard and enabling automated CRM-to-ad-platform syncs, the Monday reconciliation was replaced by a single automated report. Cross-channel questions that previously required a data pull were answered directly in the dashboard.
The shift that matters most is not the technology — it is the moment your team stops arguing about which number is right and starts acting on a shared one. MartechAI is built to get marketing teams to that moment faster, by connecting the tools they already use into a single workflow.
For teams ready to move from inventory to action, the MartechAI features page maps every capability to the specific integration and governance problems covered in this guide.
Key takeaways
Eliminating marketing data silos requires a sequenced approach: inventory first, then integration, then governance and measurement — skipping the sequence is the most common reason projects stall.
| Point | Details |
|---|---|
| Inventory before you integrate | Map all 6–8 core sources and assign stewards before building any connector. |
| Pipeline high-frequency sources first | Use integration-first pipelines for daily sources; use federated queries for monthly or ad-hoc ones. |
| Governance is the foundation | Shared metric definitions and ownership roles prevent silos from re-forming after integration. |
| Measure what changes | Track time-to-answer, manual reporting hours, and shared KPI adoption rate from Day 1. |
| MartechAI unifies the workflow | Derail Logic’s MartechAI connects CRM, analytics, campaign studio, and automation in one platform to eliminate fragmentation. |
What most guides get wrong about breaking down data silos
Most articles treat data silo elimination as a technology problem. Buy the right CDP, connect your APIs, and you are done. That framing misses the harder part.
The technology is usually the fastest piece. A competent data engineer can stand up a connector in days. What takes months is getting a paid media manager and a CRM admin to agree on what “conversion” means, and then getting both of them to stop maintaining their own local spreadsheets after the unified dashboard goes live.
The cultural and organizational shift required to move from siloed data ownership to collaborative data sharing is where most projects slow down. Teams that succeed treat governance as a product, not a policy document. They assign a named owner to every metric definition, run weekly data quality reviews, and celebrate the first time a cross-channel question gets answered in under five minutes.
The other thing guides underestimate: the delivery layer. You can build a perfect data warehouse and still have silos if the clean data never makes it back into the tools marketers use every day. Reverse ETL is not optional; it is what closes the loop. Without it, your CRM team keeps their spreadsheet because the unified dashboard does not push data into their workflow.
One practical note on omnichannel data unification: the teams that get the most value from integration are the ones who define the customer journey questions they want to answer before they build the pipeline. Starting with the question, not the connector, keeps the project focused and makes the ROI case much easier to make.
Pro Tip: After the pilot goes live, schedule a 30-minute “data wins” review every two weeks. Share one cross-channel insight the team could not have surfaced before integration. Nothing sustains adoption faster than a concrete example of the unified data doing something useful.
MartechAI gives marketing teams a faster path to unified data
Fragmented data is not just a reporting inconvenience. It is the reason marketing budgets get cut, attribution stays broken, and analysts spend Monday mornings reconciling spreadsheets instead of finding the next growth opportunity.
Derail Logic built MartechAI specifically for marketing teams that need to connect their tools, campaigns, and data without waiting months for a central IT project. The platform connects your CRM, analytics, email, and campaign systems into a single workflow, with an AI Engine that queries live sources and surfaces insights without manual exports. For teams that want to move from inventory to a working pilot fast, the marketing automation service is the practical starting point: connect your highest-value sources, automate your key syncs, and get your team reporting from a single source of truth. Request a demo or start a pilot directly from the MartechAI platform page.
Research and further reading
For teams that want to go deeper on specific technical or governance approaches, these sources are worth bookmarking.
- Breaking down data silos — Fivetran’s overview of enterprise silo disruption statistics and integration patterns; useful for the business case section.
- Marketing Data Integration: Complete Guide to Unified Analytics in 2025 — Covers core source types, shared KPI alignment with finance, and integration method selection.
- Funnel Data Hub: integration-first approach — Explains the transform-on-read model and why raw storage gives marketing teams more analytical flexibility.
- Marketing data integration guide — Funnel’s breakdown of extraction, transformation, storage, and delivery; strong on the reverse ETL last-mile problem.
- Breaking Data Silos: Beyond ETL (2026 Guide) — Covers federated analysis as an alternative to full ETL pipelines; includes realistic timeline and cost estimates.
- Data silos explained: problems they cause and solutions — Databricks’ case for the lakehouse architecture and unified governance with Unity Catalog.
- What Are Data Silos? — IBM’s treatment of the organizational and cultural dimensions of silo formation and elimination.
- Marketing Data Integration: Types, Benefits, & Best Practices — NetSuite’s practical guide to integration methods, governance requirements, and common pitfalls.
- Why analytics in marketing drives better ROI — Partner resource on the business value of unified marketing analytics; useful for building the executive case.
FAQ
What is the problem with data silos in marketing?
Data silos prevent marketing teams from combining channel data for attribution, audience suppression, and cross-channel reporting. The result is broken attribution, wasted ad spend, and hours of manual reconciliation every week.
What is the best way to break down silos in a marketing organization?
Start with a data inventory to map every source and assign ownership, then build integration-first pipelines for your highest-frequency sources. Governance, specifically shared metric definitions and named data stewards, is what keeps silos from re-forming after integration.
What is an example of a data silo in marketing?
A common example: your CRM tracks lead-to-revenue with one attribution model while your paid media platform reports conversions with a different window and identity method. Neither team can reconcile the numbers, so budget decisions are made on incomplete data.
What does it mean to remove silos in a marketing team?
Removing silos means creating a state where every channel team pulls campaign performance data from the same source, uses the same metric definitions, and can answer cross-channel questions without a manual data pull. It requires both technical integration and a governance model that keeps definitions consistent over time.
How does MartechAI help eliminate data silos?
Derail Logic’s MartechAI connects CRM, analytics, campaign studio, and marketing automation into a single workflow, with an AI Engine that queries multiple live sources. Teams using MartechAI replace manual reconciliation with automated syncs and a unified dashboard that surfaces cross-channel insights directly.