



Customer journey analytics stitches cross-session behavioral data into continuous customer arcs, revealing which sequences of touchpoints actually drive conversion, retention, and churn. It matters because most teams still measure isolated sessions, missing the paths that connect a first visit to a lost sale six weeks later. This guide walks through the definition, the metrics that matter, a step-by-step workflow, and a real example you can adapt this quarter.
TL;DR:
- Most teams should focus on analyzing key customer paths like research, abandonment, and recovery to identify high-impact friction points.
- Effective journey analysis requires consistent data collection, identity stitching across channels, and selecting sequence-based KPIs like path frequency and conversion by path.
- Fixes such as optimized recovery campaigns can significantly increase conversion rates, especially if previous paths like abandoned checkout are addressed.
- Building a rapid, repeatable workflow enables quick testing of interventions, reducing the time between insight discovery and action.
- Using integrated tools like MartechAI streamlines data unification and campaign orchestration, making it easier for lean teams to act on journey insights.
Table of Contents
- What Is Customer Journey Analytics?
- Journey Analytics vs. Journey Mapping: What’s the Difference?
- What Business Outcomes Does Journey Analytics Drive?
- Which KPIs Should You Track for Journey Analytics?
- How Do You Analyze the Customer Journey Step by Step?
- What Data and Technology Do You Need for Reliable Journey Analytics?
- What Does a Real Journey Analysis Look Like in Practice?
- What Are the Common Pitfalls in Implementing Journey Analytics?
- How Does MartechAI Support the Journey Analytics Workflow?
- How Should Marketing Teams Prioritize This Work?
- Get Help Turning Journey Insights Into Action
- Where to Learn More About Journey Analytics and Instrumentation
- Sources
- FAQ
What Is Customer Journey Analytics?
Customer journey analytics is the practice of connecting a customer’s behavior across multiple sessions, devices, and channels into a single continuous record, then measuring which sequences of touchpoints precede a business outcome. It goes beyond counting pageviews or session conversions. It answers questions like: which combination of email opens, product page visits, and support chats shows up most often before someone upgrades, and which sequence shows up most often before someone churns.
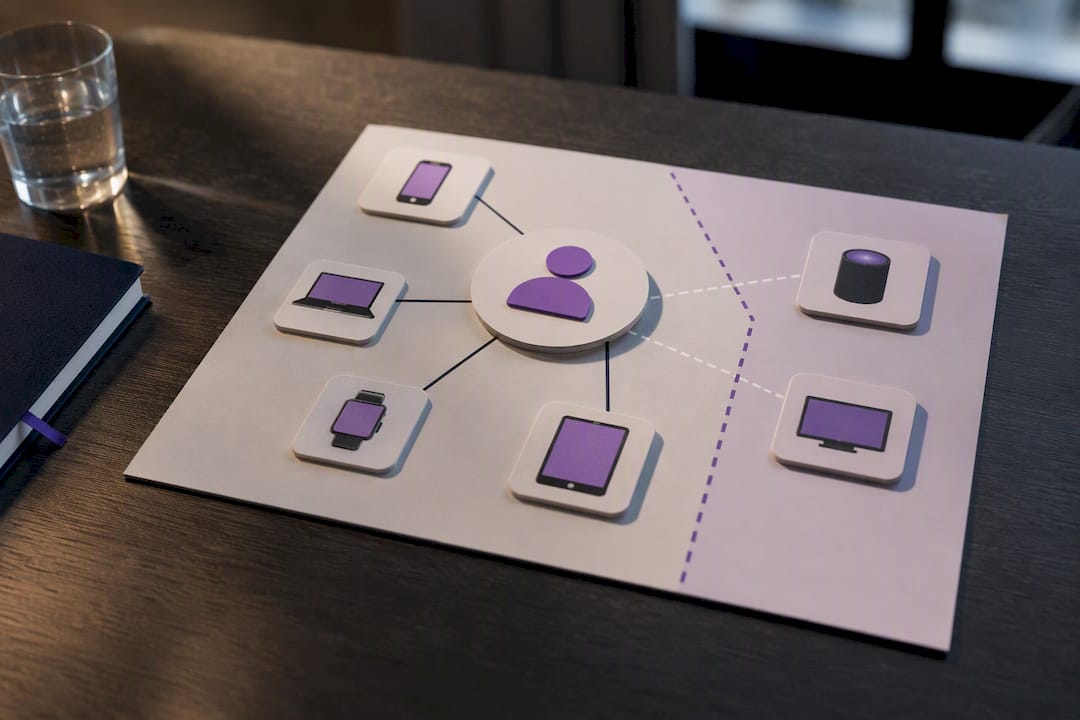
The mechanism behind this is identity resolution and session stitching, which links anonymous browsing behavior to a known customer profile once they log in, submit an email, or complete a purchase. Without stitching, every visit looks like a new person. With it, a single customer’s twelve touchpoints over three weeks become one traceable arc.
What this typically reveals:
- The exact paths that precede a purchase, not just the last click before it
- Where customers repeat a behavior (like revisiting pricing pages) without converting
- Early warning signals, such as a support ticket followed by reduced engagement, that predict churn weeks in advance
- Which channels work together versus which ones cannibalize each other’s credit
That last point trips up a lot of attribution models built around last-touch logic. Journey analytics doesn’t award credit to one touchpoint. It shows the whole sequence.
Journey Analytics vs. Journey Mapping: What’s the Difference?
Journey mapping is a design exercise. A team sits in a workshop, sketches the customer’s expected path from awareness to purchase to renewal, and marks where friction might exist based on interviews, support tickets, or gut instinct. Journey analytics is the empirical check on that map: it measures what customers actually do, using real event data, not assumptions.
The two work best in sequence, not in competition:
- Use mapping workshops to generate hypotheses about where friction lives (a confusing checkout step, a support handoff that loses context)
- Use analytics queries to test those hypotheses against real path and conversion data
- Update the map when the data contradicts the assumption, which happens more often than most teams expect
Run a mapping session when you’re onboarding a new product line or a team hasn’t looked at the customer path in over a year. Run an analytics query when you already suspect a specific drop-off and need to quantify it before asking for budget to fix it.
What Business Outcomes Does Journey Analytics Drive?
The value shows up in three places: conversion, retention, and churn prevention. Journey analytics ties specific moments in the customer path to downstream results, so teams stop guessing which fix matters most and start prioritizing by measurable impact.
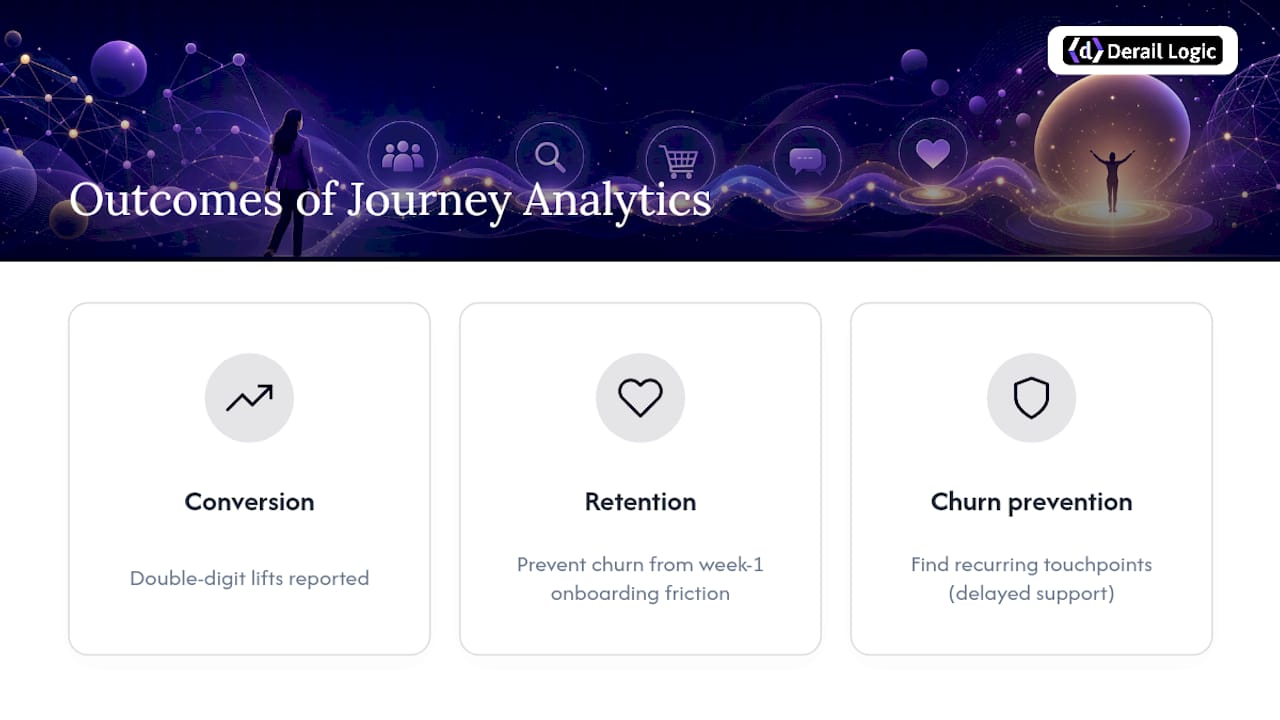
Statistic Callout: Organizations that act on journey insights report double-digit improvements in conversion and meaningful retention gains after using journey data to inform product or CX changes, according to vendor and case-study reporting from Genesys.
Retention gains tend to come from catching early friction before it compounds. A customer who hits a confusing onboarding step in week one is far more likely to churn in month three, but that connection is invisible unless you’re tracking the full arc, not just week-one metrics in isolation.
Churn reduction works the same way in reverse: teams that map churn back to the touchpoints preceding it often find a single recurring pattern, like a delayed support response after a billing question, showing up across a disproportionate share of canceled accounts. Fix that one moment, and the churn curve bends before you touch pricing or product.
Which KPIs Should You Track for Journey Analytics?
Journey analytics needs metrics that describe sequences, not single events. A handful of numbers do most of the work.
- Path frequency: how often a specific sequence of touchpoints occurs across your customer base
- Conversion rate by path: how conversion probability changes based on the sequence and length of the journey
- Time-to-convert: the elapsed time between first touch and purchase, segmented by path
- Churn probability by path: which sequences correlate with cancellation or lapse
- CSAT, NPS, and CES by journey stage: satisfaction and effort scores tied to specific moments, not just post-purchase surveys
- Customer lifetime value (CLV) and LTV:CAC: whether the paths driving conversion also drive durable, profitable customers
| Metric category | Example metric | What it tells you |
|---|---|---|
| Path behavior | Path frequency, time-to-convert | Which sequences are common and how long they take |
| Customer experience | CSAT, NPS, CES by stage | Where satisfaction drops within the journey |
| Business impact | CLV, churn probability, LTV:CAC | Whether journey patterns translate into revenue |
Vendor and dashboard guidance across the ecommerce KPI space consistently points to this same short list. The mistake most teams make is tracking dozens of metrics with no connective thread. Pick the handful that map to a decision you’re actually going to make.
How Do You Analyze the Customer Journey Step by Step?
Running a journey analysis isn’t a single query. It’s a sequence of decisions, each one narrowing the scope until you land on a testable action.
- Define the business question and success metric. Are you trying to explain why trial users don’t convert, or why renewal rates dropped last quarter? Pick one.
- Inventory the touchpoints and data sources involved. List every channel a customer could realistically pass through for that question: web, email, support, ads, in-app events.
- Instrument events and unify the event model. Every touchpoint needs a consistent event structure (name, timestamp, user ID, channel) so the pieces can be joined later.
- Run identity stitching. Connect anonymous and known sessions into single customer profiles using login events, email captures, or device matching.
- Run path and pattern analysis. Surface the most common sequences and rank them by frequency and by how strongly they correlate with your success metric.
- Design and measure an intervention. Pick the highest-impact friction point, build a test, and measure whether fixing it moves the metric you defined in step one.
This sequence mirrors the standard approach documented by Matomo for running journey analysis from question to experiment, and it holds up regardless of which platform executes it.
Pro Tip: Don’t try to instrument every possible event in month one. Start with a single funnel and a small set of high-signal events. You’ll get to a testable insight faster than if you spend eight weeks building a perfect data model nobody has used yet.
What Data and Technology Do You Need for Reliable Journey Analytics?
Reliable journey analytics depends more on data discipline than on any single analytics feature. Get the foundation wrong and every dashboard built on top of it will mislead you.
Every event needs a consistent taxonomy: a clear name, a timestamp, a user or session identifier, and a channel tag. Without that structure, joining data across sources becomes guesswork.
On sources, most teams need to pull from:
- Website and app behavioral events
- CRM records (deal stage, account owner, contract status)
- Support ticket systems
- Email engagement data
- Ad platform click and impression data, leveraging commerce-focused analytics solutions like Shurq — Amazon Seller Analytics & AI Automation Platform
Enterprise approaches emphasize cross-channel collection and identity stitching precisely because a journey built from web data alone misses the support ticket or the ad click that actually explains the behavior.
Identity resolution has real limits, though. Cross-device matching is probabilistic in places, and privacy regulations restrict how much you can link across contexts without consent. Community guidance from analysts using enterprise platforms recommends designing experiments that account for these gaps rather than assuming perfect linkage.
Pro Tip: Build a weekly data quality check into your pipeline, not a quarterly audit. Journey data breaks quietly. A tracking script that stops firing on one page can silently distort a month of path analysis before anyone notices.
What Does a Real Journey Analysis Look Like in Practice?
A common pattern shows up across ecommerce and subscription businesses alike: research → trial or signup → abandoned checkout → email recovery attempt → purchase. This archetype appears repeatedly in case studies because it captures a moment where intent is high but friction stops the transaction cold.
Here’s how an analyst would work through it:
- Isolate the path. Pull every customer who hit checkout, abandoned it, and later purchased, and separate them from customers who purchased on the first attempt.
- Calculate path frequency. Say this recovery path accounts for a sizable share of all completed purchases, hiding behind a single abandoned-checkout event.
- Compare conversion rates. Customers who received a recovery email convert at a meaningfully higher rate than those who didn’t, which tells you the email is doing real work, not just riding along with intent that already existed.
- Estimate uplift potential. If recovery emails currently reach only 60% of abandoners, closing that gap represents direct, quantifiable revenue sitting in an existing workflow.
Statistic Callout: Journey analytics ties specific friction points, like checkout abandonment, directly to downstream revenue outcomes, letting teams prioritize fixes by measurable business impact instead of by intuition.
The recommended next move: an A/B test that sends the recovery email at a different delay interval (say, one hour versus twenty-four), with purchase completion within seven days as the success metric.
What Are the Common Pitfalls in Implementing Journey Analytics?
Most journey analytics programs fail for procedural reasons, not technical ones.
- Starting with “analyze everything” instead of one funnel and one business question
- Letting event taxonomy drift as different teams name the same event differently across platforms
- Assuming identity stitching is perfect, then building experiments that collapse when cross-device matching misses a segment of users
- Producing beautiful dashboards that nobody turns into a prioritized action
- Skipping stakeholder buy-in from support, product, or sales before pulling data that touches their systems
The fix for most of these is sequencing: define the question first, get the right teams in the room before instrumentation starts, and treat the first dashboard as a hypothesis generator, not a finished product.
How Does MartechAI Support the Journey Analytics Workflow?
Running the workflow above by hand across five disconnected tools is exactly the fragmentation problem MartechAI was built to solve. Its intelligent CRM and deep analytics layer already unify the data sources (web, email, CRM, support) that identity stitching depends on, instead of leaving an analyst to reconcile exports from four separate systems.
Mapped to the steps above:
- Data unification replaces manual joins across web analytics, CRM, and email platforms with one connected data model
- Visual campaign studio lets teams turn a discovered friction point (like the checkout abandonment path) directly into a targeted recovery campaign without switching tools
- Analytics dashboards track path frequency and conversion by segment continuously, rather than through one-off exports
The practical value shows up in cycle time: cohort analysis and campaign orchestration happen in the same workspace, so the gap between “we found the friction” and “we tested the fix” shrinks from weeks to days.
How Should Marketing Teams Prioritize This Work?
Start with support and product, not just marketing. They surface the friction points worth measuring before you touch pricing or acquisition. Run one small pilot on a single funnel before pitching a platform investment. Track quick wins (recovery campaign lift) separately from long-term metrics (churn reduction, CLV), because they move on different timelines and mixing them muddies the ROI story.
— Zachary
Get Help Turning Journey Insights Into Action
Most teams don’t lack insight, they lack the connected workflow to act on it before the moment passes. Derail Logic’s marketing automation service takes the friction points your journey analysis surfaces, like the abandoned checkout pattern covered above, and turns them into orchestrated campaigns without a separate build cycle for every fix.
Instead of exporting journey data into one tool, building the campaign in another, and reporting results in a third, MartechAI’s visual campaign studio and intelligent CRM keep the whole loop, insight, campaign, measurement, in one workspace. That matters most for lean marketing teams who don’t have a dedicated analyst stitching spreadsheets together every week. If your team has already identified a friction point worth fixing, the next step is straightforward: start a trial and build the recovery campaign directly from the data you already have.
Where to Learn More About Journey Analytics and Instrumentation
For deeper technical grounding, the Adobe Experience League overview of customer journey analytics covers cross-channel collection in enterprise detail. Matomo’s step-by-step analysis guide is a solid reference for the workflow itself. For metric selection, Derail Logic’s guide to marketing analytics metrics and its breakdown of multi-channel tracking setup both expand on sections covered above.
Sources
- What is Customer Journey Analytics? | Conviva Glossary
- Customer Journey Analytics overview – Experience League – Adobe
- How to Conduct a Customer Journey Analysis (Step-by-Step) – Matomo
FAQ
What Is Customer Journey Analytics?
Customer journey analytics is the measurement of behavior across multiple sessions and channels, stitched into one continuous customer record, to identify which sequences of touchpoints drive conversion, retention, or churn.
What Are Examples of Customer Journey Analytics?
Common examples include tracing a research to trial to abandoned checkout to email recovery to purchase path, or identifying that a support ticket followed by reduced engagement predicts churn weeks before cancellation.
What Are the Main Elements of a Customer Journey?
Most frameworks track awareness, consideration, conversion, retention, and advocacy, though the specific stages a team measures should reflect their actual funnel rather than a generic template.
How Do You Analyze the Customer Journey?
Define a business question, map the touchpoints involved, instrument consistent events, stitch identities across sessions, run path analysis to find common sequences, then test an intervention on the highest-impact friction point.
How Is Journey Analytics Different From a Marketing Dashboard?
A standard marketing or ecommerce KPI dashboard usually reports isolated metrics per channel, while journey analytics connects those metrics into sequences that show how touchpoints interact across a customer’s full path.