



Aim for a Largest Contentful Paint under 2.5 seconds; the best-converting pages hit under 2 seconds. Landing page speed is how fast your page becomes visually usable and interactive for a real visitor, and it now functions as a direct conversion metric, not just a technical box to check. Run a field test and a lab waterfall today, then fix whatever surfaces first: usually the hero image, a third-party script, or a blocking font.
TL;DR:
- Serving hero images as WebP or AVIF and sizing them correctly can significantly reduce load time and boost conversion rates.
- Regularly auditing third-party scripts and removing or deferring non-essential tags prevents them from slowing down the page.
- Monitoring real-user metrics like field data from PageSpeed Insights ensures improvements translate to actual visitor experience.
- Fixing font loading delays with preload and font-display swap can cut LCP times by half a second or more.
- Prioritizing speed as a marketing metric and automating performance monitoring helps prevent regressions and maximizes ROI.
Table of Contents
- What Tools Should You Use to Test Landing Page Speed?
- Which Metrics Actually Predict Whether Visitors Convert?
- What Actually Moves the Needle on Load Time?
- How Do You Measure and Monitor Speed Over Time?
- Landing Page Speed Checklist and Audit Schedule
- How We Treat Speed as a Conversion Lever, Not an IT Ticket
- Why Marketing Teams Get Landing Page Speed Backward
- Automate the Monitoring So Speed Fixes Don’t Get Forgotten
- Where to Verify These Benchmarks Yourself
- Sources
- FAQ
What Tools Should You Use to Test Landing Page Speed?
You don’t need five different tools open at once. You need the right one for the question you’re asking.
Start with PageSpeed Insights. It gives you two data sets in one report: field data pulled from the Chrome UX Report (how real visitors actually experienced your page over the past 28 days) and lab data from a single simulated Lighthouse run. Field data tells you the truth. Lab data tells you why.
For asset-level detective work, run a waterfall. GTmetrix breaks down every request on the page, so you can see exactly which image, script, or font is holding up your Largest Contentful Paint (LCP), and it tracks history so you catch regressions before a client does.
For controlled, repeatable checks, especially before and after a fix, synthetic monitoring tools like Pingdom let you test from a fixed location on a fixed schedule, removing the noise real-world traffic introduces.
Quick rule: use field data to know if you have a problem, lab and waterfall data to know what’s causing it.
- PageSpeed Insights — field + lab Core Web Vitals in one report
- GTmetrix — waterfall breakdown to find the exact blocking asset
- Pingdom — synthetic runs for repeatable before/after comparisons
- Chrome DevTools — free, built-in, good for quick local debugging
Which Metrics Actually Predict Whether Visitors Convert?
Three metrics make up Core Web Vitals, and they matter because each maps to a moment a visitor either sticks around or bounces.
Largest Contentful Paint (LCP) measures when the biggest visible element, usually your hero image or headline, finishes rendering. Google’s own guidance treats this as the primary loading signal, and the target is under 2.5 seconds. On a landing page, LCP is often the entire ballgame: if the visitor doesn’t see your offer fast, they don’t wait around to see it slow.
Interaction to Next Paint (INP) measures responsiveness, how long it takes the page to react after someone clicks, taps, or types. Keep it under 200 milliseconds. A slow INP on a form field or CTA button is a silent conversion killer.
Cumulative Layout Shift (CLS) measures visual stability. Keep it under 0.1. Anyone who’s tried to tap a button that jumped half an inch because an ad loaded late knows exactly what a bad CLS score feels like.
Core Web Vitals benchmarks: LCP < 2.5s, INP < 200ms, CLS < 0.1. Pages that clear all three convert measurably better than pages that don’t, according to landing page benchmark data.
One more distinction worth knowing: Time to First Byte (TTFB) isn’t a Core Web Vital, but it’s the floor under your LCP. If your server takes 1.5 seconds just to respond, no amount of image compression saves your LCP score.
What Actually Moves the Needle on Load Time?
Not every fix is worth the same engineering hour. Here’s the priority order, ranked by typical impact on LCP and, by extension, conversions.
- Fix the hero image first. This is almost always the single largest lever. Serve WebP or AVIF instead of JPEG or PNG, size the image to its actual display dimensions (not 4000px wide for a 600px slot), and compress aggressively. 2026 benchmark data links load times under 2 seconds to substantial revenue uplift, with image weight as the most common fix behind that jump.
- Audit third-party scripts. Tag managers, chat widgets, heat-map tools, and ad pixels pile up fast on marketing pages. Pull up your waterfall, sort by blocking time, and cut or defer anything that isn’t paying rent. Oversized hero images and unchecked third-party tags are consistently the top two causes of slow landing pages.
- Fix your fonts. Add
font-display: swapso text renders in a fallback font while the custom one loads, and preload the specific font files your hero text uses with<link rel="preload" as="font">. A blocking font request can single-handedly delay your LCP by half a second or more. - Lazy-load everything below the fold. Add
loading="lazy"to images and iframes that aren’t in the initial viewport, and defer noncritical JavaScript with thedeferattribute so it doesn’t block rendering. - Put a CDN in front of everything, and confirm HTTP/2 or HTTP/3. A CDN cuts the physical distance between your server and the visitor; modern HTTP protocols let the browser pull multiple assets in parallel instead of one at a time. Together, they’re often the fastest way to cut TTFB without touching a single line of application code.
Pro Tip: After any fix, check the response headers in your browser’s network tab to confirm caching and compression are actually active, don’t just assume the CDN config took effect.
If you run e-commerce landing pages specifically, mobile-first performance deserves its own pass. Shopify’s guidance points to lightweight themes and trimmed app lists as the difference between a fast mobile page and a bloated one, since mobile connections amplify every one of these problems.
How Do You Measure and Monitor Speed Over Time?
Speed work isn’t a one-time project. It’s a loop: baseline, fix, validate, monitor, repeat.
Baseline. Before touching anything, capture both a field reading from PageSpeed Insights and a waterfall snapshot from GTmetrix. Write both numbers down. You’ll need them to prove the fix worked.
Validate in staging first. Run your lab test against the staged version before it goes live. Lab data is your quality gate. Field data from CrUX is your reality check, but it takes days to accumulate enough real-user sessions to trust.
Confirm with real-user data. Once live, cross-check your analytics for bounce rate and time-on-page shifts alongside the Core Web Vitals report. If load time dropped but conversions didn’t move, the bottleneck wasn’t speed, and conversion tracking will tell you where to look next.
Set a monitoring cadence:
- Run a full audit monthly as a baseline habit
- Audit weekly during active campaign pushes with heavy traffic
- Audit immediately after adding any new script, pixel, or marketing app
Marketing stacks accumulate tools faster than anyone remembers to remove them, and speed regresses quietly every time a new tag gets dropped in.
Landing Page Speed Checklist and Audit Schedule
Keep this list next to your deploy button.
- Hero image compressed, correctly sized, served as WebP or AVIF
- Third-party scripts audited; anything nonessential deferred or removed
- Fonts preloaded with
font-display: swapset - Below-the-fold images and iframes lazy-loaded
- CDN active, HTTP/2 or HTTP/3 confirmed
- Caching headers verified in the network tab post-deploy
| Trigger | Recommended action |
|---|---|
| Standing baseline | Monthly full audit (field + lab) |
| Active campaign or traffic spike | Weekly spot-check |
| New tag, pixel, or app added | Immediate re-audit |
| Post-deploy | Verify caching and compression headers live |
How We Treat Speed as a Conversion Lever, Not an IT Ticket
Inside marketing operations, speed audits usually get filed under engineering and forgotten. That’s backward. A slow landing page creates friction in the customer journey that can reduce the effectiveness of marketing spend. Derail Logic’s analytics dashboards surface page performance next to campaign metrics, so a drop in LCP shows up beside the traffic source that’s about to hit it. Assign speed checks the way you’d assign a broken CTA: to whoever owns the page that week, checked before the next campaign push, not after.
Why Marketing Teams Get Landing Page Speed Backward
Most teams treat speed as an engineering problem to eventually get to. That framing is the mistake. The benchmark data is consistent: pages under 2.5 seconds LCP convert measurably better, and the fixes that get you there, image compression, script pruning, font preloading, are mostly design and marketing decisions dressed up in technical language.
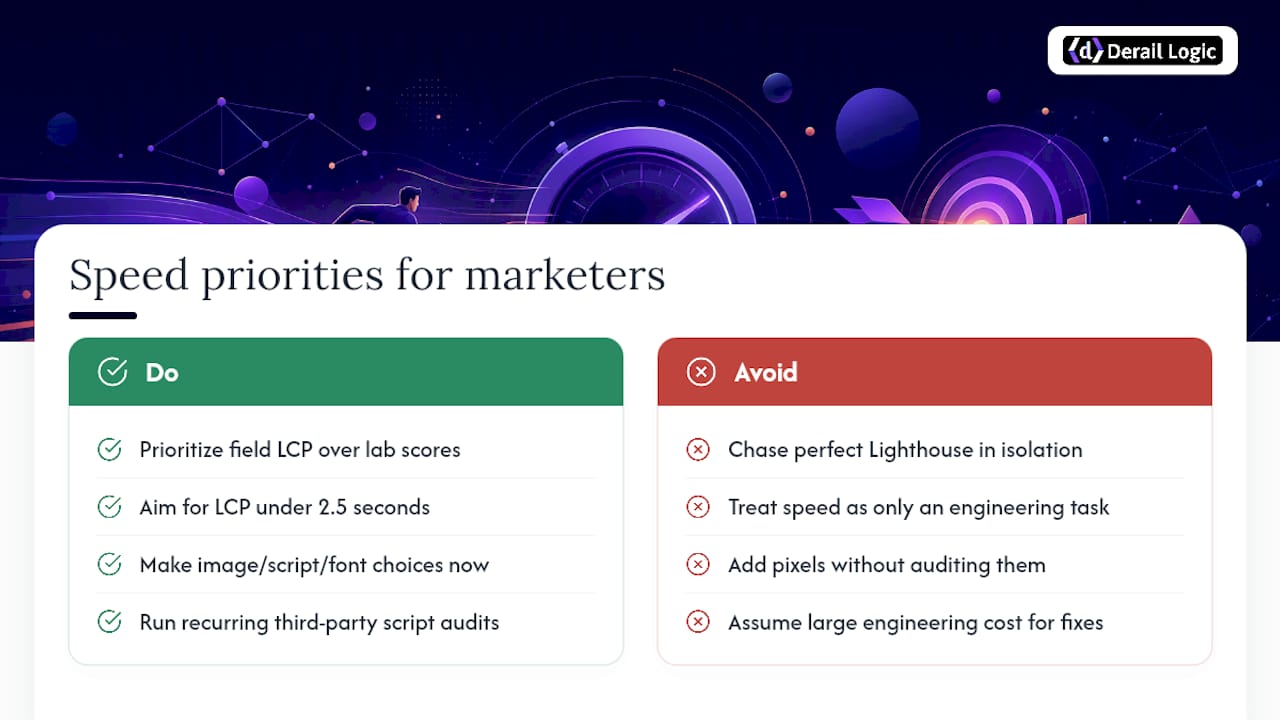
The overrated fix is chasing a perfect Lighthouse score in a vacuum. A page can score 100 in the lab and still convert poorly if the field data tells a different story to real visitors on real connections. Chase the field number first.
What’s underrated is treating a third-party script audit as a recurring marketing task, not a one-time cleanup. Every new pixel a campaign manager adds is a small tax on load time, and nobody circles back to remove the ones that stopped earning their keep. If you want ROI language your engineering lead will actually respond to: a half-second LCP improvement is worth more to revenue than most A/B tests you’ll run this quarter, and it costs less engineering time than most people assume.
— Zachary
Automate the Monitoring So Speed Fixes Don’t Get Forgotten
Derail Logic gives marketing teams a faster path to fixing speed problems than filing an engineering ticket and waiting. Instead of switching between five separate speed tools and a spreadsheet of who’s responsible for what, your analytics dashboard, landing page builder, and task management live in one workflow, so a performance drop gets flagged and assigned in the same place your campaigns already run.
The AI Engine pulls from your live campaign and analytics data to flag when a page’s performance shift lines up with a traffic or conversion change, so you’re not guessing whether a speed dip is costing you money. Autopilot can surface those regressions before you’d catch them manually, and marketing automation lets you route the fix straight to whoever owns the page. If your team is tired of speed audits falling through the cracks between marketing and engineering, start a trial and connect your first landing page today.
Where to Verify These Benchmarks Yourself
- PageSpeed Insights for Core Web Vitals field and lab reports
- GTmetrix for waterfall breakdowns and historical tracking
- Google’s developer documentation on how Core Web Vitals are measured
- Landing page speed and SEO for the ranking and conversion connection
Sources
- PageSpeed Insights
- GTmetrix | Website Performance Testing and Monitoring
- Roast
- Landing page load time impact on conversion rate: 2026 data – Markana Media
- Make the Web Faster | Google for Developers
FAQ
What Is a Good Landing Page Speed?
An LCP under 2.5 seconds meets Google’s threshold for a “good” score, but the best-converting pages tend to load in under 2 seconds. INP should stay under 200 milliseconds and CLS under 0.1.
Can I Check the Speed of a Website for Free?
Yes. PageSpeed Insights and GTmetrix are both free and give you Core Web Vitals scores plus a breakdown of what’s slowing the page down.
How Do I Check Landing Page Performance Properly?
Run a field test first to see how real visitors experience the page, then run a lab waterfall to identify the specific asset causing the delay. Fix that asset, then re-test both to confirm the improvement held.
What Is the Fastest Website on the Internet?
There’s no single verified record for the fastest live website, since load times shift constantly with traffic, location, and device. What’s measurable is the target: pages that consistently hit sub-2-second LCP tend to strip third-party scripts aggressively and serve every image pre-optimized through a CDN.
Does Landing Page Speed Really Affect Conversion Rate?
Yes. Load times dropping below 2 seconds are tied to substantial revenue uplift in recent benchmark data, and image optimization is typically the single largest lever behind that gain.